

Control by Heat (Thermal Processing) ◾ 453
where x and y represent, respectively, microbial numbers before and after exposure at temperature
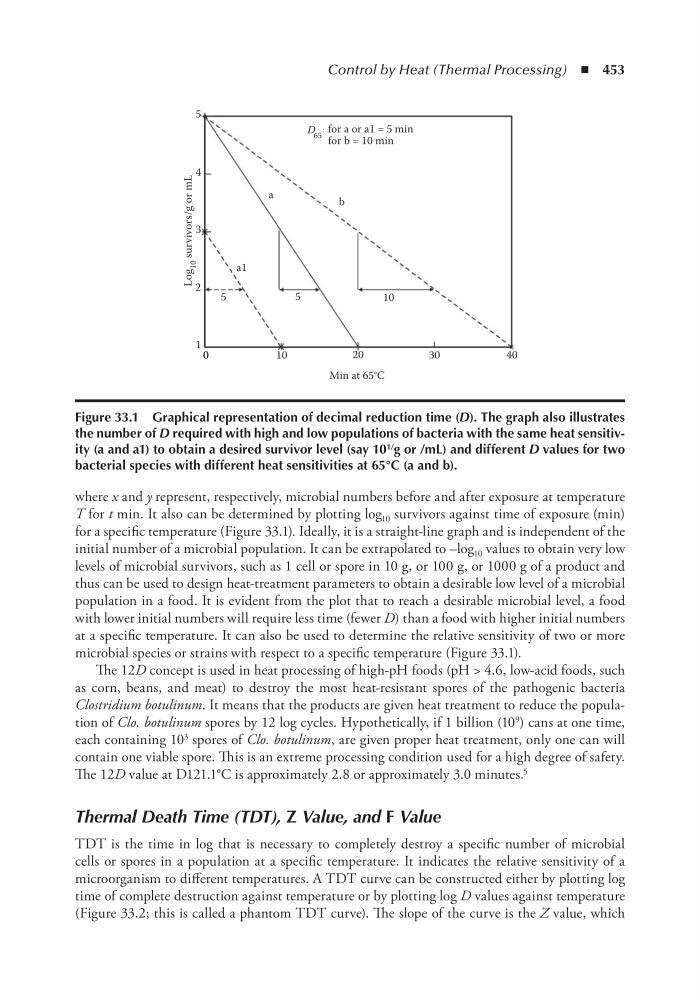
T for t min. It also can be determined by plotting log 10 survivors against time of exposure (min)
for a specific temperature (Figure 33.1). Ideally, it is a straight-line graph and is independent of the
initial number of a microbial population. It can be extrapolated to –log 10 values to obtain very low
levels of microbial survivors, such as 1 cell or spore in 10 g, or 100 g, or 1000 g of a product and
thus can be used to design heat-treatment parameters to obtain a desirable low level of a microbial
population in a food. It is evident from the plot that to reach a desirable microbial level, a food
with lower initial numbers will require less time (fewer D) than a food with higher initial numbers
at a specific temperature. It can also be used to determine the relative sensitivity of two or more
microbial species or strains with respect to a specific temperature (Figure 33.1).
The 12D concept is used in heat processing of high-pH foods (pH > 4.6, low-acid foods, such
as corn, beans, and meat) to destroy the most heat-resistant spores of the pathogenic bacteria
Clostridium botulinum. It means that the products are given heat treatment to reduce the population of Clo. botulinum spores by 12 log cycles. Hypothetically, if 1 billion (10 9 ) cans at one time,
each containing 10 3 spores of Clo. botulinum, are given proper heat treatment, only one can will
contain one viable spore. This is an extreme processing condition used for a high degree of safety.
The 12D value at D121.1°C is approximately 2.8 or approximately 3.0 minutes. 5
Thermal Death Time (TDT), Z Value, and F Value
TDT is the time in log that is necessary to completely destroy a specific number of microbial
cells or spores in a population at a specific temperature. It indicates the relative sensitivity of a
microorganism to different temperatures. A TDT curve can be constructed either by plotting log
time of complete destruction against temperature or by plotting log D values against temperature
(Figure 33.2; this is called a phantom TDT curve). The slope of the curve is the Z value, which
D 65
: for a or a1 = 5 min
for b = 10 min
a
5
b
a1
5
5
10
0
1 0
20
0
1
2
30
40
Log
10
survivors/g or mL
4
3
Min at 65°C
Figure 33.1 Graphical representation of decimal reduction time (D). the graph also illustrates
the number of D required with high and low populations of bacteria with the same heat sensitivity (a and a1) to obtain a desired survivor level (say 10 1/ g or /mL) and different D values for two
bacterial species with different heat sensitivities at 65°C (a and b).
where x and y represent, respectively, microbial numbers before and after exposure at temperature
T for t min. It also can be determined by plotting log 10 survivors against time of exposure (min)
for a specific temperature (Figure 33.1). Ideally, it is a straight-line graph and is independent of the
initial number of a microbial population. It can be extrapolated to –log 10 values to obtain very low
levels of microbial survivors, such as 1 cell or spore in 10 g, or 100 g, or 1000 g of a product and
thus can be used to design heat-treatment parameters to obtain a desirable low level of a microbial
population in a food. It is evident from the plot that to reach a desirable microbial level, a food
with lower initial numbers will require less time (fewer D) than a food with higher initial numbers
at a specific temperature. It can also be used to determine the relative sensitivity of two or more
microbial species or strains with respect to a specific temperature (Figure 33.1).
The 12D concept is used in heat processing of high-pH foods (pH > 4.6, low-acid foods, such
as corn, beans, and meat) to destroy the most heat-resistant spores of the pathogenic bacteria
Clostridium botulinum. It means that the products are given heat treatment to reduce the population of Clo. botulinum spores by 12 log cycles. Hypothetically, if 1 billion (10 9 ) cans at one time,
each containing 10 3 spores of Clo. botulinum, are given proper heat treatment, only one can will
contain one viable spore. This is an extreme processing condition used for a high degree of safety.
The 12D value at D121.1°C is approximately 2.8 or approximately 3.0 minutes. 5
Thermal Death Time (TDT), Z Value, and F Value
TDT is the time in log that is necessary to completely destroy a specific number of microbial
cells or spores in a population at a specific temperature. It indicates the relative sensitivity of a
microorganism to different temperatures. A TDT curve can be constructed either by plotting log
time of complete destruction against temperature or by plotting log D values against temperature
(Figure 33.2; this is called a phantom TDT curve). The slope of the curve is the Z value, which
D 65
: for a or a1 = 5 min
for b = 10 min
a
5
b
a1
5
5
10
0
1 0
20
0
1
2
30
40
Log
10
survivors/g or mL
4
3
Min at 65°C
Figure 33.1 Graphical representation of decimal reduction time (D). the graph also illustrates
the number of D required with high and low populations of bacteria with the same heat sensitivity (a and a1) to obtain a desired survivor level (say 10 1/ g or /mL) and different D values for two
bacterial species with different heat sensitivities at 65°C (a and b).