

273
P
A
b
c mg mL
/
205
31
(2)
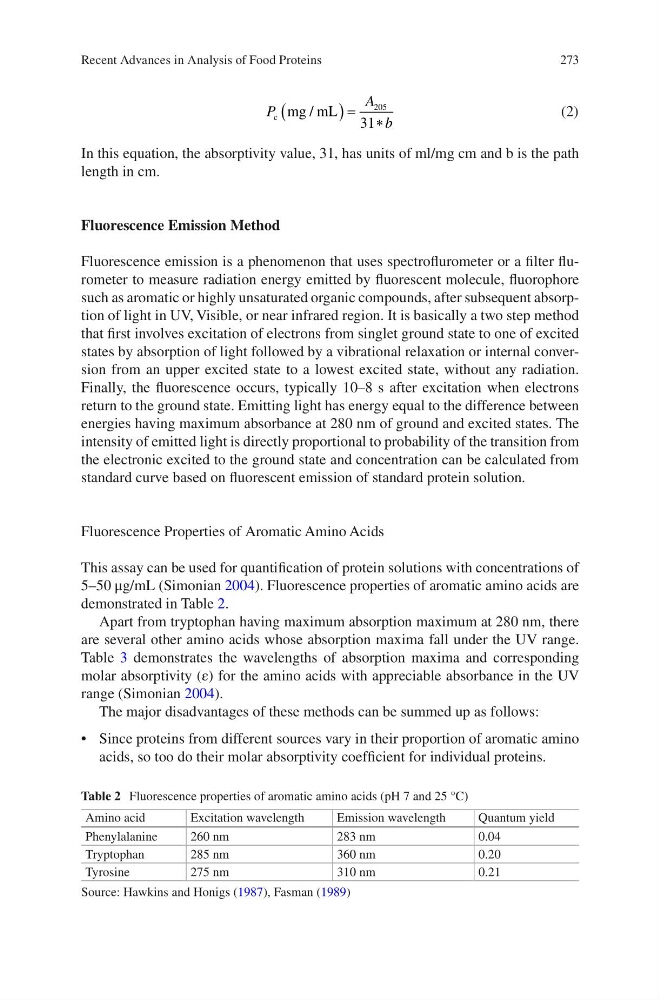
In this equation, the absorptivity value, 31, has units of ml/mg cm and b is the path
length in cm.
Fluorescence Emission Method
Fluorescence emission is a phenomenon that uses spectroflurometer or a filter flurometer to measure radiation energy emitted by fluorescent molecule, fluorophore
such as aromatic or highly unsaturated organic compounds, after subsequent absorption of light in UV, Visible, or near infrared region. It is basically a two step method
that first involves excitation of electrons from singlet ground state to one of excited
states by absorption of light followed by a vibrational relaxation or internal conversion from an upper excited state to a lowest excited state, without any radiation.
Finally, the fluorescence occurs, typically 10–8 s after excitation when electrons
return to the ground state. Emitting light has energy equal to the difference between
energies having maximum absorbance at 280 nm of ground and excited states. The
intensity of emitted light is directly proportional to probability of the transition from
the electronic excited to the ground state and concentration can be calculated from
standard curve based on fluorescent emission of standard protein solution.
Fluorescence Properties of Aromatic Amino Acids
This assay can be used for quantification of protein solutions with concentrations of
5–50 μg/mL (Simonian 2004). Fluorescence properties of aromatic amino acids are
demonstrated in Table 2.
Apart from tryptophan having maximum absorption maximum at 280 nm, there
are several other amino acids whose absorption maxima fall under the UV range.
Table 3 demonstrates the wavelengths of absorption maxima and corresponding
molar absorptivity (ε) for the amino acids with appreciable absorbance in the UV
range (Simonian 2004).
The major disadvantages of these methods can be summed up as follows:
• Since proteins from different sources vary in their proportion of aromatic amino
acids, so too do their molar absorptivity coefficient for individual proteins.
Table 2 Fluorescence properties of aromatic amino acids (pH 7 and 25 °C)
Amino acid
Excitation wavelength
Emission wavelength
Quantum yield
Phenylalanine
260 nm
283 nm
0.04
Tryptophan
285 nm
360 nm
0.20
Tyrosine
275 nm
310 nm
0.21
Source: Hawkins and Honigs (1987), Fasman (1989)
Recent Advances in Analysis of Food Proteins
P
A
b
c mg mL
/
205
31
(2)
In this equation, the absorptivity value, 31, has units of ml/mg cm and b is the path
length in cm.
Fluorescence Emission Method
Fluorescence emission is a phenomenon that uses spectroflurometer or a filter flurometer to measure radiation energy emitted by fluorescent molecule, fluorophore
such as aromatic or highly unsaturated organic compounds, after subsequent absorption of light in UV, Visible, or near infrared region. It is basically a two step method
that first involves excitation of electrons from singlet ground state to one of excited
states by absorption of light followed by a vibrational relaxation or internal conversion from an upper excited state to a lowest excited state, without any radiation.
Finally, the fluorescence occurs, typically 10–8 s after excitation when electrons
return to the ground state. Emitting light has energy equal to the difference between
energies having maximum absorbance at 280 nm of ground and excited states. The
intensity of emitted light is directly proportional to probability of the transition from
the electronic excited to the ground state and concentration can be calculated from
standard curve based on fluorescent emission of standard protein solution.
Fluorescence Properties of Aromatic Amino Acids
This assay can be used for quantification of protein solutions with concentrations of
5–50 μg/mL (Simonian 2004). Fluorescence properties of aromatic amino acids are
demonstrated in Table 2.
Apart from tryptophan having maximum absorption maximum at 280 nm, there
are several other amino acids whose absorption maxima fall under the UV range.
Table 3 demonstrates the wavelengths of absorption maxima and corresponding
molar absorptivity (ε) for the amino acids with appreciable absorbance in the UV
range (Simonian 2004).
The major disadvantages of these methods can be summed up as follows:
• Since proteins from different sources vary in their proportion of aromatic amino
acids, so too do their molar absorptivity coefficient for individual proteins.
Table 2 Fluorescence properties of aromatic amino acids (pH 7 and 25 °C)
Amino acid
Excitation wavelength
Emission wavelength
Quantum yield
Phenylalanine
260 nm
283 nm
0.04
Tryptophan
285 nm
360 nm
0.20
Tyrosine
275 nm
310 nm
0.21
Source: Hawkins and Honigs (1987), Fasman (1989)
Recent Advances in Analysis of Food Proteins