

274
• These spectrophotometric measurements, however, is subjected to interference
by presence of many components such as solvents and biological buffers that
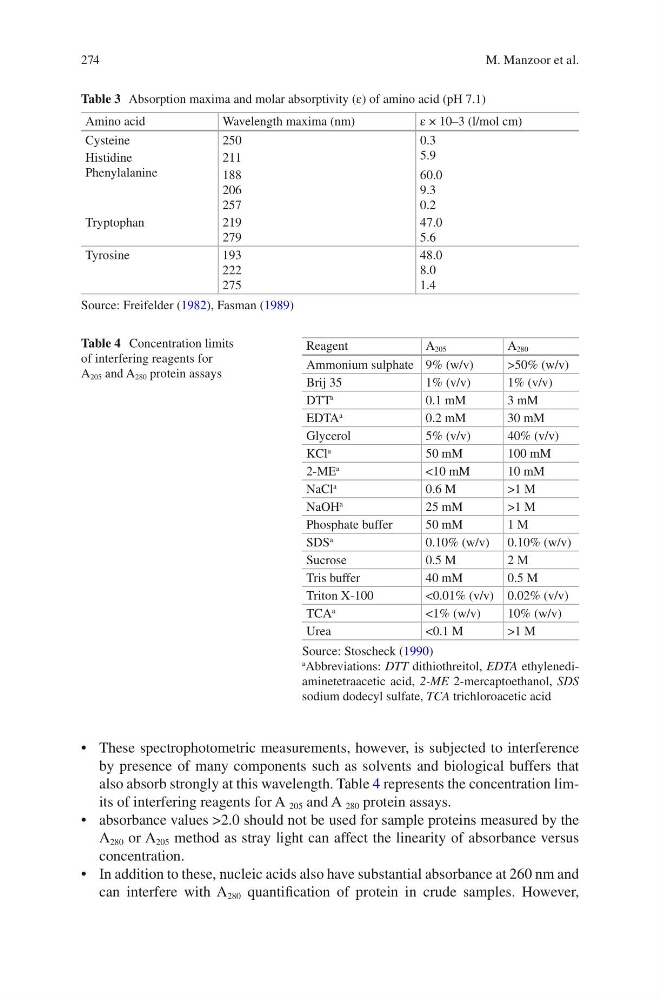
also absorb strongly at this wavelength. Table 4 represents the concentration limits of interfering reagents for A 205 and A 280 protein assays.
• absorbance values >2.0 should not be used for sample proteins measured by the
A 280 or A 205 method as stray light can affect the linearity of absorbance versus
concentration.
• In addition to these, nucleic acids also have substantial absorbance at 260 nm and
can interfere with A 280 quantification of protein in crude samples. However,
Table 4 Concentration limits
of interfering reagents for
A 205 and A 280 protein assays
Reagent
A 205
A 280
Ammonium sulphate 9% (w/v)
>50% (w/v)
Brij 35
1% (v/v)
1% (v/v)
DTT
a
0.1 mM
3 mM
EDTA
a
0.2 mM
30 mM
Glycerol
5% (v/v)
40% (v/v)
KCl
a
50 mM
100 mM
2-ME
a
<10 mM
10 mM
NaCl
a
0.6 M
>1 M
NaOH
a
25 mM
>1 M
Phosphate buffer
50 mM
1 M
SDS
a
0.10% (w/v) 0.10% (w/v)
Sucrose
0.5 M
2 M
Tris buffer
40 mM
0.5 M
Triton X-100
<0.01% (v/v) 0.02% (v/v)
TCA
a
<1% (w/v)
10% (w/v)
Urea
<0.1 M
>1 M
Source: Stoscheck (1990)
a
Abbreviations: DTT dithiothreitol, EDTA ethylenediaminetetraacetic acid, 2-ME 2-mercaptoethanol, SDS
sodium dodecyl sulfate, TCA trichloroacetic acid
Table 3 Absorption maxima and molar absorptivity (ε) of amino acid (pH 7.1)
Amino acid
Wavelength maxima (nm)
ε × 10–3 (l/mol cm)
Cysteine
250
0.3
5.9
Histidine
Phenylalanine
211
188
206
257
60.0
9.3
0.2
Tryptophan
219
279
47.0
5.6
Tyrosine
193
222
275
48.0
8.0
1.4
Source: Freifelder (1982), Fasman (1989)
M. Manzoor et al.
• These spectrophotometric measurements, however, is subjected to interference
by presence of many components such as solvents and biological buffers that
also absorb strongly at this wavelength. Table 4 represents the concentration limits of interfering reagents for A 205 and A 280 protein assays.
• absorbance values >2.0 should not be used for sample proteins measured by the
A 280 or A 205 method as stray light can affect the linearity of absorbance versus
concentration.
• In addition to these, nucleic acids also have substantial absorbance at 260 nm and
can interfere with A 280 quantification of protein in crude samples. However,
Table 4 Concentration limits
of interfering reagents for
A 205 and A 280 protein assays
Reagent
A 205
A 280
Ammonium sulphate 9% (w/v)
>50% (w/v)
Brij 35
1% (v/v)
1% (v/v)
DTT
a
0.1 mM
3 mM
EDTA
a
0.2 mM
30 mM
Glycerol
5% (v/v)
40% (v/v)
KCl
a
50 mM
100 mM
2-ME
a
<10 mM
10 mM
NaCl
a
0.6 M
>1 M
NaOH
a
25 mM
>1 M
Phosphate buffer
50 mM
1 M
SDS
a
0.10% (w/v) 0.10% (w/v)
Sucrose
0.5 M
2 M
Tris buffer
40 mM
0.5 M
Triton X-100
<0.01% (v/v) 0.02% (v/v)
TCA
a
<1% (w/v)
10% (w/v)
Urea
<0.1 M
>1 M
Source: Stoscheck (1990)
a
Abbreviations: DTT dithiothreitol, EDTA ethylenediaminetetraacetic acid, 2-ME 2-mercaptoethanol, SDS
sodium dodecyl sulfate, TCA trichloroacetic acid
Table 3 Absorption maxima and molar absorptivity (ε) of amino acid (pH 7.1)
Amino acid
Wavelength maxima (nm)
ε × 10–3 (l/mol cm)
Cysteine
250
0.3
5.9
Histidine
Phenylalanine
211
188
206
257
60.0
9.3
0.2
Tryptophan
219
279
47.0
5.6
Tyrosine
193
222
275
48.0
8.0
1.4
Source: Freifelder (1982), Fasman (1989)
M. Manzoor et al.