

Table 6.24 First wave of the COVID-19 epidemic in Kyiv
Number of
prediction/optimal
values of
parameters,
characteristics
Prediction 1
n = 14
Period taken for
calculations T c :
March 28–April
10, 2020
Prediction 2
n = 14
Period taken for
calculations T c : April
11–24, 2020
Prediction 3
n = 14
Period taken for
calculations T c : May
13–26, 2020
N
3572.256
3025.6064
3916.224
m
3287.84315106509
1887.90132535378
1901.88529953178
a
0.00064332173
0.00011892581484817
6.31210877007e-05
t
Ã
1
13.4243281820969
−1.03084215697423
6.20323541303859
q
2.11514094406513
0.224520203470638
0.120049068788449
1=q
0.472781732492
4.45394215995700
8.32992717138191
r
0.995627168903
0.996747099239341
0.996899503409035
F, Eq. (2.9)
1363.11536701815
1835.51243347698
1926.17853220408
F=F C ð1; n À 2Þ
73.2857724203304
98.6834641654292
126.722271855531
S 1 , Eq. (4.9)
3009
1078
735
V 1 , Eq. (4.16)
563
1947
3181
t final , Eq. (4.17)
55
121
172
Final day of the
first wave
April 27, 2020
July 2, 2020
August 22, 2020
V f , taken from [80]
1298
5347
11,804
e, Eq. (4.20)
56.6%
63.6%
73.1%
Optimal values of parameters and other SIR model characteristics for different predictions
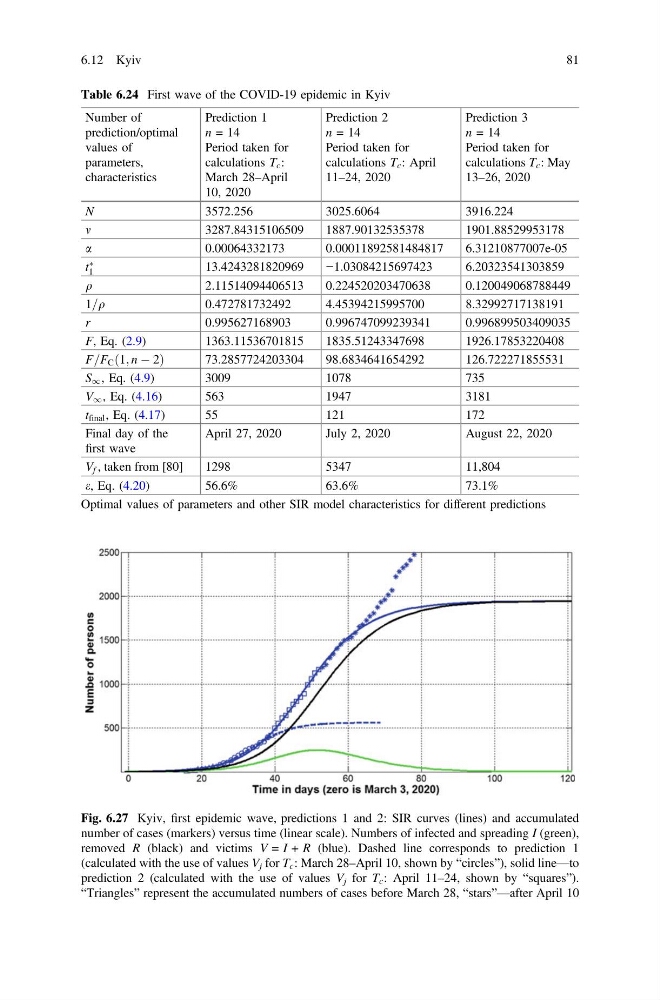
Fig. 6.27 Kyiv, first epidemic wave, predictions 1 and 2: SIR curves (lines) and accumulated
number of cases (markers) versus time (linear scale). Numbers of infected and spreading I (green),
removed R (black) and victims V = I + R (blue). Dashed line corresponds to prediction 1
(calculated with the use of values V j for T c : March 28–April 10, shown by “circles”), solid line—to
prediction 2 (calculated with the use of values V j for T c : April 11–24, shown by “squares”).
“Triangles” represent the accumulated numbers of cases before March 28, “stars”—after April 10
6.12 Kyiv
81
Number of
prediction/optimal
values of
parameters,
characteristics
Prediction 1
n = 14
Period taken for
calculations T c :
March 28–April
10, 2020
Prediction 2
n = 14
Period taken for
calculations T c : April
11–24, 2020
Prediction 3
n = 14
Period taken for
calculations T c : May
13–26, 2020
N
3572.256
3025.6064
3916.224
m
3287.84315106509
1887.90132535378
1901.88529953178
a
0.00064332173
0.00011892581484817
6.31210877007e-05
t
Ã
1
13.4243281820969
−1.03084215697423
6.20323541303859
q
2.11514094406513
0.224520203470638
0.120049068788449
1=q
0.472781732492
4.45394215995700
8.32992717138191
r
0.995627168903
0.996747099239341
0.996899503409035
F, Eq. (2.9)
1363.11536701815
1835.51243347698
1926.17853220408
F=F C ð1; n À 2Þ
73.2857724203304
98.6834641654292
126.722271855531
S 1 , Eq. (4.9)
3009
1078
735
V 1 , Eq. (4.16)
563
1947
3181
t final , Eq. (4.17)
55
121
172
Final day of the
first wave
April 27, 2020
July 2, 2020
August 22, 2020
V f , taken from [80]
1298
5347
11,804
e, Eq. (4.20)
56.6%
63.6%
73.1%
Optimal values of parameters and other SIR model characteristics for different predictions
Fig. 6.27 Kyiv, first epidemic wave, predictions 1 and 2: SIR curves (lines) and accumulated
number of cases (markers) versus time (linear scale). Numbers of infected and spreading I (green),
removed R (black) and victims V = I + R (blue). Dashed line corresponds to prediction 1
(calculated with the use of values V j for T c : March 28–April 10, shown by “circles”), solid line—to
prediction 2 (calculated with the use of values V j for T c : April 11–24, shown by “squares”).
“Triangles” represent the accumulated numbers of cases before March 28, “stars”—after April 10
6.12 Kyiv
81