

The first laboratory confirmed COVID-19 case in Kyiv was registered on March
19, 2020 (see Tables 6.20 and 5.1). Since in Ukraine the PLC tests were introduced
for pneumonia patients and the medical staff only after April 10, 2020, it was
interesting to investigate how the new testing algorithm changed the epidemic
dynamics in Kyiv. For this purpose, we have used two data sets for the periods
March 28–April 10 and April 11–24. The results of SIR simulations are presented
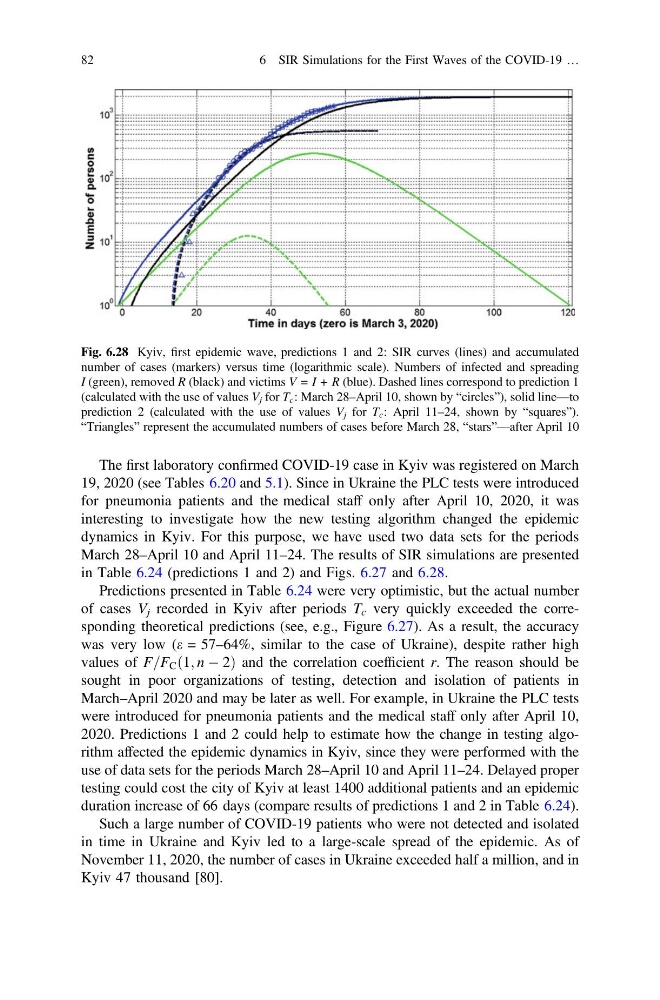
in Table 6.24 (predictions 1 and 2) and Figs. 6.27 and 6.28.
Predictions presented in Table 6.24 were very optimistic, but the actual number
of cases V j recorded in Kyiv after periods T c very quickly exceeded the corresponding theoretical predictions (see, e.g., Figure 6.27). As a result, the accuracy
was very low (e = 57–64%, similar to the case of Ukraine), despite rather high
values of F=F C ð1; n À 2Þ and the correlation coefficient r. The reason should be
sought in poor organizations of testing, detection and isolation of patients in
March–April 2020 and may be later as well. For example, in Ukraine the PLC tests
were introduced for pneumonia patients and the medical staff only after April 10,
2020. Predictions 1 and 2 could help to estimate how the change in testing algorithm affected the epidemic dynamics in Kyiv, since they were performed with the
use of data sets for the periods March 28–April 10 and April 11–24. Delayed proper
testing could cost the city of Kyiv at least 1400 additional patients and an epidemic
duration increase of 66 days (compare results of predictions 1 and 2 in Table 6.24).
Such a large number of COVID-19 patients who were not detected and isolated
in time in Ukraine and Kyiv led to a large-scale spread of the epidemic. As of
November 11, 2020, the number of cases in Ukraine exceeded half a million, and in
Kyiv 47 thousand [80].
Fig. 6.28 Kyiv, first epidemic wave, predictions 1 and 2: SIR curves (lines) and accumulated
number of cases (markers) versus time (logarithmic scale). Numbers of infected and spreading
I (green), removed R (black) and victims V = I + R (blue). Dashed lines correspond to prediction 1
(calculated with the use of values V j for T c : March 28–April 10, shown by “circles”), solid line—to
prediction 2 (calculated with the use of values V j for T c : April 11–24, shown by “squares”).
“Triangles” represent the accumulated numbers of cases before March 28, “stars”—after April 10
82
6 SIR Simulations for the First Waves of the COVID-19 …
19, 2020 (see Tables 6.20 and 5.1). Since in Ukraine the PLC tests were introduced
for pneumonia patients and the medical staff only after April 10, 2020, it was
interesting to investigate how the new testing algorithm changed the epidemic
dynamics in Kyiv. For this purpose, we have used two data sets for the periods
March 28–April 10 and April 11–24. The results of SIR simulations are presented
in Table 6.24 (predictions 1 and 2) and Figs. 6.27 and 6.28.
Predictions presented in Table 6.24 were very optimistic, but the actual number
of cases V j recorded in Kyiv after periods T c very quickly exceeded the corresponding theoretical predictions (see, e.g., Figure 6.27). As a result, the accuracy
was very low (e = 57–64%, similar to the case of Ukraine), despite rather high
values of F=F C ð1; n À 2Þ and the correlation coefficient r. The reason should be
sought in poor organizations of testing, detection and isolation of patients in
March–April 2020 and may be later as well. For example, in Ukraine the PLC tests
were introduced for pneumonia patients and the medical staff only after April 10,
2020. Predictions 1 and 2 could help to estimate how the change in testing algorithm affected the epidemic dynamics in Kyiv, since they were performed with the
use of data sets for the periods March 28–April 10 and April 11–24. Delayed proper
testing could cost the city of Kyiv at least 1400 additional patients and an epidemic
duration increase of 66 days (compare results of predictions 1 and 2 in Table 6.24).
Such a large number of COVID-19 patients who were not detected and isolated
in time in Ukraine and Kyiv led to a large-scale spread of the epidemic. As of
November 11, 2020, the number of cases in Ukraine exceeded half a million, and in
Kyiv 47 thousand [80].
Fig. 6.28 Kyiv, first epidemic wave, predictions 1 and 2: SIR curves (lines) and accumulated
number of cases (markers) versus time (logarithmic scale). Numbers of infected and spreading
I (green), removed R (black) and victims V = I + R (blue). Dashed lines correspond to prediction 1
(calculated with the use of values V j for T c : March 28–April 10, shown by “circles”), solid line—to
prediction 2 (calculated with the use of values V j for T c : April 11–24, shown by “squares”).
“Triangles” represent the accumulated numbers of cases before March 28, “stars”—after April 10
82
6 SIR Simulations for the First Waves of the COVID-19 …