

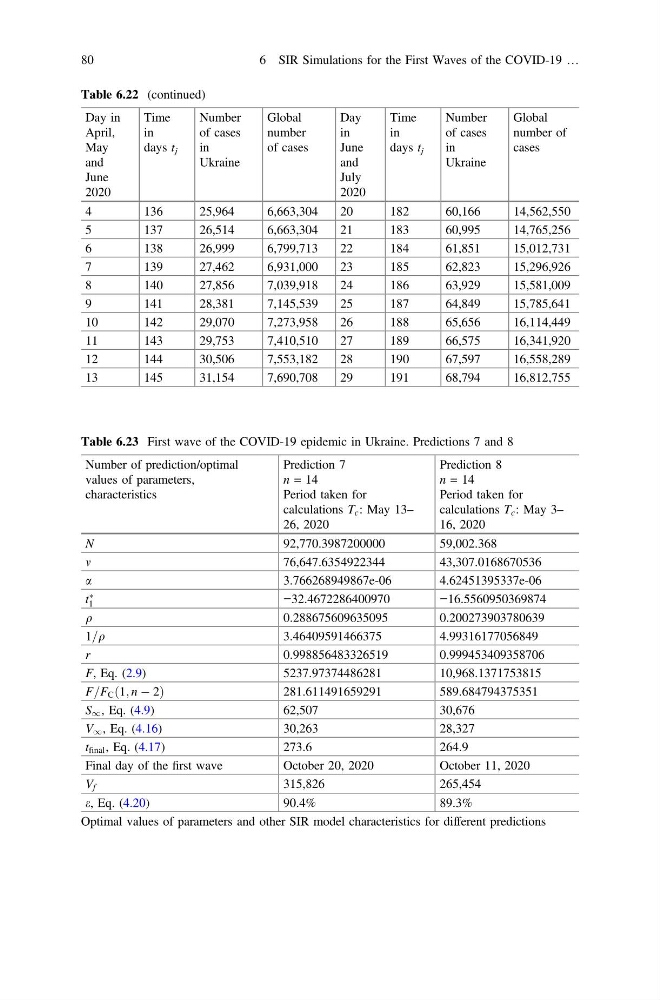
Table 6.22 (continued)
Day in
April,
May
and
June
2020
Time
in
days t j
Number
of cases
in
Ukraine
Global
number
of cases
Day
in
June
and
July
2020
Time
in
days t j
Number
of cases
in
Ukraine
Global
number of
cases
4
136
25,964
6,663,304
20
182
60,166
14,562,550
5
137
26,514
6,663,304
21
183
60,995
14,765,256
6
138
26,999
6,799,713
22
184
61,851
15,012,731
7
139
27,462
6,931,000
23
185
62,823
15,296,926
8
140
27,856
7,039,918
24
186
63,929
15,581,009
9
141
28,381
7,145,539
25
187
64,849
15,785,641
10
142
29,070
7,273,958
26
188
65,656
16,114,449
11
143
29,753
7,410,510
27
189
66,575
16,341,920
12
144
30,506
7,553,182
28
190
67,597
16,558,289
13
145
31,154
7,690,708
29
191
68,794
16,812,755
Table 6.23 First wave of the COVID-19 epidemic in Ukraine. Predictions 7 and 8
Number of prediction/optimal
values of parameters,
characteristics
Prediction 7
n = 14
Period taken for
calculations T c : May 13–
26, 2020
Prediction 8
n = 14
Period taken for
calculations T c : May 3–
16, 2020
N
92,770.3987200000
59,002.368
m
76,647.6354922344
43,307.0168670536
a
3.766268949867e-06
4.62451395337e-06
t
Ã
1
−32.4672286400970
−16.5560950369874
q
0.288675609635095
0.200273903780639
1=q
3.46409591466375
4.99316177056849
r
0.998856483326519
0.999453409358706
F, Eq. (2.9)
5237.97374486281
10,968.1371753815
F=F C ð1; n À 2Þ
281.611491659291
589.684794375351
S 1 , Eq. (4.9)
62,507
30,676
V 1 , Eq. (4.16)
30,263
28,327
t final , Eq. (4.17)
273.6
264.9
Final day of the first wave
October 20, 2020
October 11, 2020
V f
315,826
265,454
e, Eq. (4.20)
90.4%
89.3%
Optimal values of parameters and other SIR model characteristics for different predictions
80
6 SIR Simulations for the First Waves of the COVID-19 …
Day in
April,
May
and
June
2020
Time
in
days t j
Number
of cases
in
Ukraine
Global
number
of cases
Day
in
June
and
July
2020
Time
in
days t j
Number
of cases
in
Ukraine
Global
number of
cases
4
136
25,964
6,663,304
20
182
60,166
14,562,550
5
137
26,514
6,663,304
21
183
60,995
14,765,256
6
138
26,999
6,799,713
22
184
61,851
15,012,731
7
139
27,462
6,931,000
23
185
62,823
15,296,926
8
140
27,856
7,039,918
24
186
63,929
15,581,009
9
141
28,381
7,145,539
25
187
64,849
15,785,641
10
142
29,070
7,273,958
26
188
65,656
16,114,449
11
143
29,753
7,410,510
27
189
66,575
16,341,920
12
144
30,506
7,553,182
28
190
67,597
16,558,289
13
145
31,154
7,690,708
29
191
68,794
16,812,755
Table 6.23 First wave of the COVID-19 epidemic in Ukraine. Predictions 7 and 8
Number of prediction/optimal
values of parameters,
characteristics
Prediction 7
n = 14
Period taken for
calculations T c : May 13–
26, 2020
Prediction 8
n = 14
Period taken for
calculations T c : May 3–
16, 2020
N
92,770.3987200000
59,002.368
m
76,647.6354922344
43,307.0168670536
a
3.766268949867e-06
4.62451395337e-06
t
Ã
1
−32.4672286400970
−16.5560950369874
q
0.288675609635095
0.200273903780639
1=q
3.46409591466375
4.99316177056849
r
0.998856483326519
0.999453409358706
F, Eq. (2.9)
5237.97374486281
10,968.1371753815
F=F C ð1; n À 2Þ
281.611491659291
589.684794375351
S 1 , Eq. (4.9)
62,507
30,676
V 1 , Eq. (4.16)
30,263
28,327
t final , Eq. (4.17)
273.6
264.9
Final day of the first wave
October 20, 2020
October 11, 2020
V f
315,826
265,454
e, Eq. (4.20)
90.4%
89.3%
Optimal values of parameters and other SIR model characteristics for different predictions
80
6 SIR Simulations for the First Waves of the COVID-19 …