

Figures 6.25 and 6.26 illustrate the results of estimations 2 and 3. Figure 6.25
shows that even prediction 3 was too optimistic. New cases registered after corresponding period T c and shown by “stars” deviate from the solid blue line very
fast. Unfortunately, new calculations (performed with the use of fresher data sets
(e.g., shown in Table 6.22)) yielded similar results. The results of some of these
forecasts are shown in the Tables 5.2 and 6.23 and Figs. 6.15 and 6.16. Figure 6.16
shows how quickly the results of observations V j (blue “stars”) deviate from the
theoretical dependence V(t) (blue solid line). The obtained results and comparisons
with the above forecasts for the EU countries allow us to conclude that the premature easing of quarantine in Ukraine led to the beginning of the second and
subsequent waves of the epidemic before the end of the first wave. Probably, we
have similar dynamics in the UK, Moldova, USA and the world. The next waves of
the pandemic will be discussed in the following chapters.
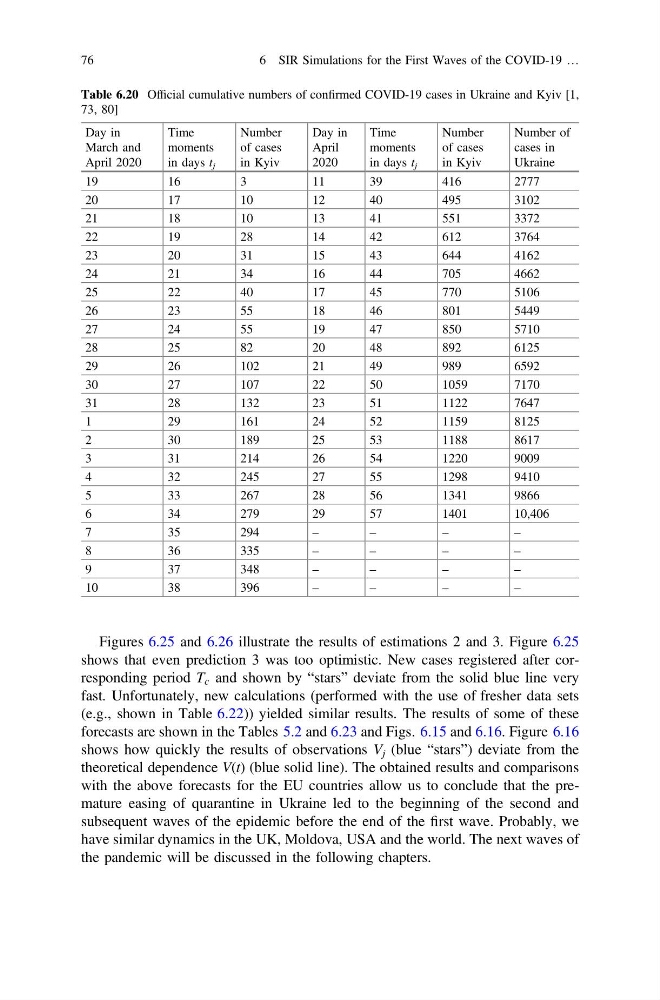
Table 6.20 Official cumulative numbers of confirmed COVID-19 cases in Ukraine and Kyiv [1,
73, 80]
Day in
March and
April 2020
Time
moments
in days t j
Number
of cases
in Kyiv
Day in
April
2020
Time
moments
in days t j
Number
of cases
in Kyiv
Number of
cases in
Ukraine
19
16
3
11
39
416
2777
20
17
10
12
40
495
3102
21
18
10
13
41
551
3372
22
19
28
14
42
612
3764
23
20
31
15
43
644
4162
24
21
34
16
44
705
4662
25
22
40
17
45
770
5106
26
23
55
18
46
801
5449
27
24
55
19
47
850
5710
28
25
82
20
48
892
6125
29
26
102
21
49
989
6592
30
27
107
22
50
1059
7170
31
28
132
23
51
1122
7647
1
29
161
24
52
1159
8125
2
30
189
25
53
1188
8617
3
31
214
26
54
1220
9009
4
32
245
27
55
1298
9410
5
33
267
28
56
1341
9866
6
34
279
29
57
1401
10,406
7
35
294
–
–
–
–
8
36
335
–
–
–
–
9
37
348
–
–
–
–
10
38
396
–
–
–
–
76
6 SIR Simulations for the First Waves of the COVID-19 …
shows that even prediction 3 was too optimistic. New cases registered after corresponding period T c and shown by “stars” deviate from the solid blue line very
fast. Unfortunately, new calculations (performed with the use of fresher data sets
(e.g., shown in Table 6.22)) yielded similar results. The results of some of these
forecasts are shown in the Tables 5.2 and 6.23 and Figs. 6.15 and 6.16. Figure 6.16
shows how quickly the results of observations V j (blue “stars”) deviate from the
theoretical dependence V(t) (blue solid line). The obtained results and comparisons
with the above forecasts for the EU countries allow us to conclude that the premature easing of quarantine in Ukraine led to the beginning of the second and
subsequent waves of the epidemic before the end of the first wave. Probably, we
have similar dynamics in the UK, Moldova, USA and the world. The next waves of
the pandemic will be discussed in the following chapters.
Table 6.20 Official cumulative numbers of confirmed COVID-19 cases in Ukraine and Kyiv [1,
73, 80]
Day in
March and
April 2020
Time
moments
in days t j
Number
of cases
in Kyiv
Day in
April
2020
Time
moments
in days t j
Number
of cases
in Kyiv
Number of
cases in
Ukraine
19
16
3
11
39
416
2777
20
17
10
12
40
495
3102
21
18
10
13
41
551
3372
22
19
28
14
42
612
3764
23
20
31
15
43
644
4162
24
21
34
16
44
705
4662
25
22
40
17
45
770
5106
26
23
55
18
46
801
5449
27
24
55
19
47
850
5710
28
25
82
20
48
892
6125
29
26
102
21
49
989
6592
30
27
107
22
50
1059
7170
31
28
132
23
51
1122
7647
1
29
161
24
52
1159
8125
2
30
189
25
53
1188
8617
3
31
214
26
54
1220
9009
4
32
245
27
55
1298
9410
5
33
267
28
56
1341
9866
6
34
279
29
57
1401
10,406
7
35
294
–
–
–
–
8
36
335
–
–
–
–
9
37
348
–
–
–
–
10
38
396
–
–
–
–
76
6 SIR Simulations for the First Waves of the COVID-19 …