

Great values of the error e call into question the obtained estimates of the
characteristics of the epidemic. The average times of spreading infection s ¼ 1=q in
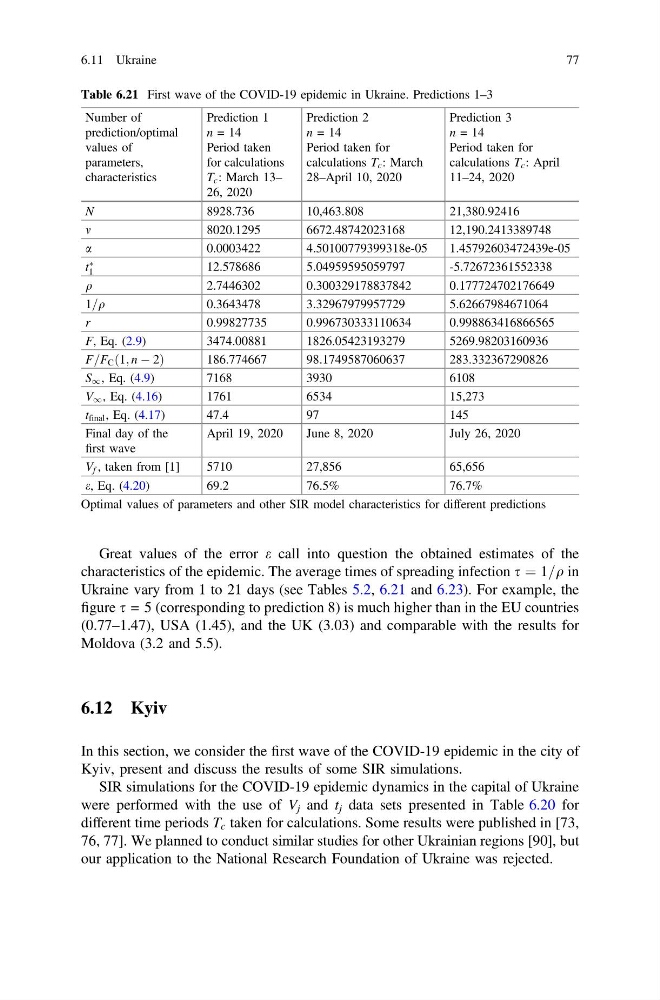
Ukraine vary from 1 to 21 days (see Tables 5.2, 6.21 and 6.23). For example, the
figure s = 5 (corresponding to prediction 8) is much higher than in the EU countries
(0.77–1.47), USA (1.45), and the UK (3.03) and comparable with the results for
Moldova (3.2 and 5.5).
6.12 Kyiv
In this section, we consider the first wave of the COVID-19 epidemic in the city of
Kyiv, present and discuss the results of some SIR simulations.
SIR simulations for the COVID-19 epidemic dynamics in the capital of Ukraine
were performed with the use of V j and t j data sets presented in Table 6.20 for
different time periods T c taken for calculations. Some results were published in [73,
76, 77]. We planned to conduct similar studies for other Ukrainian regions [90], but
our application to the National Research Foundation of Ukraine was rejected.
Table 6.21 First wave of the COVID-19 epidemic in Ukraine. Predictions 1–3
Number of
prediction/optimal
values of
parameters,
characteristics
Prediction 1
n = 14
Period taken
for calculations
T c : March 13–
26, 2020
Prediction 2
n = 14
Period taken for
calculations T c : March
28–April 10, 2020
Prediction 3
n = 14
Period taken for
calculations T c : April
11–24, 2020
N
8928.736
10,463.808
21,380.92416
m
8020.1295
6672.48742023168
12,190.2413389748
a
0.0003422
4.50100779399318e-05
1.45792603472439e-05
t
Ã
1
12.578686
5.04959595059797
-5.72672361552338
q
2.7446302
0.300329178837842
0.177724702176649
1=q
0.3643478
3.32967979957729
5.62667984671064
r
0.99827735
0.996730333110634
0.998863416866565
F, Eq. (2.9)
3474.00881
1826.05423193279
5269.98203160936
F=F C ð1; n À 2Þ
186.774667
98.1749587060637
283.332367290826
S 1 , Eq. (4.9)
7168
3930
6108
V 1 , Eq. (4.16)
1761
6534
15,273
t final , Eq. (4.17)
47.4
97
145
Final day of the
first wave
April 19, 2020
June 8, 2020
July 26, 2020
V f , taken from [1]
5710
27,856
65,656
e, Eq. (4.20)
69.2
76.5%
76.7%
Optimal values of parameters and other SIR model characteristics for different predictions
6.11 Ukraine
77
characteristics of the epidemic. The average times of spreading infection s ¼ 1=q in
Ukraine vary from 1 to 21 days (see Tables 5.2, 6.21 and 6.23). For example, the
figure s = 5 (corresponding to prediction 8) is much higher than in the EU countries
(0.77–1.47), USA (1.45), and the UK (3.03) and comparable with the results for
Moldova (3.2 and 5.5).
6.12 Kyiv
In this section, we consider the first wave of the COVID-19 epidemic in the city of
Kyiv, present and discuss the results of some SIR simulations.
SIR simulations for the COVID-19 epidemic dynamics in the capital of Ukraine
were performed with the use of V j and t j data sets presented in Table 6.20 for
different time periods T c taken for calculations. Some results were published in [73,
76, 77]. We planned to conduct similar studies for other Ukrainian regions [90], but
our application to the National Research Foundation of Ukraine was rejected.
Table 6.21 First wave of the COVID-19 epidemic in Ukraine. Predictions 1–3
Number of
prediction/optimal
values of
parameters,
characteristics
Prediction 1
n = 14
Period taken
for calculations
T c : March 13–
26, 2020
Prediction 2
n = 14
Period taken for
calculations T c : March
28–April 10, 2020
Prediction 3
n = 14
Period taken for
calculations T c : April
11–24, 2020
N
8928.736
10,463.808
21,380.92416
m
8020.1295
6672.48742023168
12,190.2413389748
a
0.0003422
4.50100779399318e-05
1.45792603472439e-05
t
Ã
1
12.578686
5.04959595059797
-5.72672361552338
q
2.7446302
0.300329178837842
0.177724702176649
1=q
0.3643478
3.32967979957729
5.62667984671064
r
0.99827735
0.996730333110634
0.998863416866565
F, Eq. (2.9)
3474.00881
1826.05423193279
5269.98203160936
F=F C ð1; n À 2Þ
186.774667
98.1749587060637
283.332367290826
S 1 , Eq. (4.9)
7168
3930
6108
V 1 , Eq. (4.16)
1761
6534
15,273
t final , Eq. (4.17)
47.4
97
145
Final day of the
first wave
April 19, 2020
June 8, 2020
July 26, 2020
V f , taken from [1]
5710
27,856
65,656
e, Eq. (4.20)
69.2
76.5%
76.7%
Optimal values of parameters and other SIR model characteristics for different predictions
6.11 Ukraine
77