

Ukraine after the period T c very quickly exceeded the corresponding theoretical
predictions (see, e.g., Fig. 6.25). As a result, the accuracy was very low (e = 69–
77%, similar to the cases of Moldova and USA), despite rather high values of
F=F C ð1; n À 2Þ and the correlation coefficient r.
The reason should be sought in poor organizations of testing, detection and
isolation of patients in March–April 2020 and may be later as well. For example, in
Ukraine the PLC tests were introduced for pneumonia patients and the medical staff
only after April 10, 2020. Predictions 2 and 3 could help to estimate how the
change in testing algorithm affected the epidemic dynamics in Ukraine, since they
were performed with the use of data sets for the periods March 28–April 10 and
April 11–24. Delayed proper testing could cost Ukraine at least 9000 additional
patients and an epidemic duration increase of 47 days (compare results of predictions 2 and 3 in Table 6.21). That is why the maximum PCR testing (especially for
medical staff and patients with pneumonia) can be recommended in all countries as
an effective means of reducing the scale and duration of the pandemic.
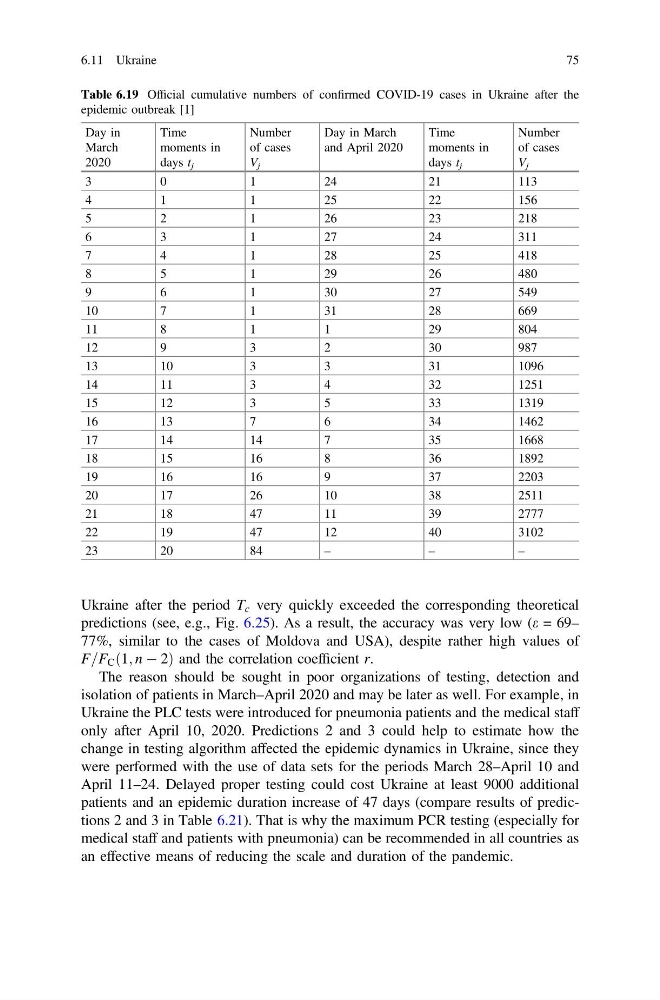
Table 6.19 Official cumulative numbers of confirmed COVID-19 cases in Ukraine after the
epidemic outbreak [1]
Day in
March
2020
Time
moments in
days t j
Number
of cases
V j
Day in March
and April 2020
Time
moments in
days t j
Number
of cases
V j
3
0
1
24
21
113
4
1
1
25
22
156
5
2
1
26
23
218
6
3
1
27
24
311
7
4
1
28
25
418
8
5
1
29
26
480
9
6
1
30
27
549
10
7
1
31
28
669
11
8
1
1
29
804
12
9
3
2
30
987
13
10
3
3
31
1096
14
11
3
4
32
1251
15
12
3
5
33
1319
16
13
7
6
34
1462
17
14
14
7
35
1668
18
15
16
8
36
1892
19
16
16
9
37
2203
20
17
26
10
38
2511
21
18
47
11
39
2777
22
19
47
12
40
3102
23
20
84
–
–
–
6.11 Ukraine
75
predictions (see, e.g., Fig. 6.25). As a result, the accuracy was very low (e = 69–
77%, similar to the cases of Moldova and USA), despite rather high values of
F=F C ð1; n À 2Þ and the correlation coefficient r.
The reason should be sought in poor organizations of testing, detection and
isolation of patients in March–April 2020 and may be later as well. For example, in
Ukraine the PLC tests were introduced for pneumonia patients and the medical staff
only after April 10, 2020. Predictions 2 and 3 could help to estimate how the
change in testing algorithm affected the epidemic dynamics in Ukraine, since they
were performed with the use of data sets for the periods March 28–April 10 and
April 11–24. Delayed proper testing could cost Ukraine at least 9000 additional
patients and an epidemic duration increase of 47 days (compare results of predictions 2 and 3 in Table 6.21). That is why the maximum PCR testing (especially for
medical staff and patients with pneumonia) can be recommended in all countries as
an effective means of reducing the scale and duration of the pandemic.
Table 6.19 Official cumulative numbers of confirmed COVID-19 cases in Ukraine after the
epidemic outbreak [1]
Day in
March
2020
Time
moments in
days t j
Number
of cases
V j
Day in March
and April 2020
Time
moments in
days t j
Number
of cases
V j
3
0
1
24
21
113
4
1
1
25
22
156
5
2
1
26
23
218
6
3
1
27
24
311
7
4
1
28
25
418
8
5
1
29
26
480
9
6
1
30
27
549
10
7
1
31
28
669
11
8
1
1
29
804
12
9
3
2
30
987
13
10
3
3
31
1096
14
11
3
4
32
1251
15
12
3
5
33
1319
16
13
7
6
34
1462
17
14
14
7
35
1668
18
15
16
8
36
1892
19
16
16
9
37
2203
20
17
26
10
38
2511
21
18
47
11
39
2777
22
19
47
12
40
3102
23
20
84
–
–
–
6.11 Ukraine
75