

cases in USA 6,960,152 (on September 26, 2020) and weekly increase 298,149
available in WHO report [86].
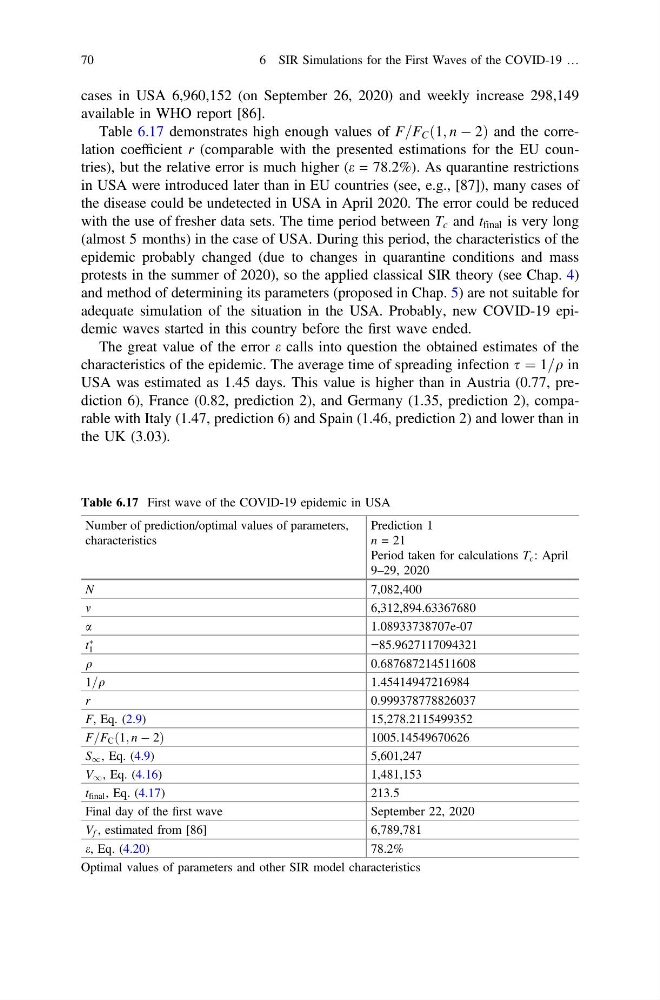
Table 6.17 demonstrates high enough values of F=F C ð1; n À 2Þ and the correlation coefficient r (comparable with the presented estimations for the EU countries), but the relative error is much higher (e = 78.2%). As quarantine restrictions
in USA were introduced later than in EU countries (see, e.g., [87]), many cases of
the disease could be undetected in USA in April 2020. The error could be reduced
with the use of fresher data sets. The time period between T c and t final is very long
(almost 5 months) in the case of USA. During this period, the characteristics of the
epidemic probably changed (due to changes in quarantine conditions and mass
protests in the summer of 2020), so the applied classical SIR theory (see Chap. 4)
and method of determining its parameters (proposed in Chap. 5) are not suitable for
adequate simulation of the situation in the USA. Probably, new COVID-19 epidemic waves started in this country before the first wave ended.
The great value of the error e calls into question the obtained estimates of the
characteristics of the epidemic. The average time of spreading infection s ¼ 1=q in
USA was estimated as 1.45 days. This value is higher than in Austria (0.77, prediction 6), France (0.82, prediction 2), and Germany (1.35, prediction 2), comparable with Italy (1.47, prediction 6) and Spain (1.46, prediction 2) and lower than in
the UK (3.03).
Table 6.17 First wave of the COVID-19 epidemic in USA
Number of prediction/optimal values of parameters,
characteristics
Prediction 1
n = 21
Period taken for calculations T c : April
9–29, 2020
N
7,082,400
m
6,312,894.63367680
a
1.08933738707e-07
t
Ã
1
−85.9627117094321
q
0.687687214511608
1=q
1.45414947216984
r
0.999378778826037
F, Eq. (2.9)
15,278.2115499352
F=F C ð1; n À 2Þ
1005.14549670626
S 1 , Eq. (4.9)
5,601,247
V 1 , Eq. (4.16)
1,481,153
t final , Eq. (4.17)
213.5
Final day of the first wave
September 22, 2020
V f , estimated from [86]
6,789,781
e, Eq. (4.20)
78.2%
Optimal values of parameters and other SIR model characteristics
70
6 SIR Simulations for the First Waves of the COVID-19 …
available in WHO report [86].
Table 6.17 demonstrates high enough values of F=F C ð1; n À 2Þ and the correlation coefficient r (comparable with the presented estimations for the EU countries), but the relative error is much higher (e = 78.2%). As quarantine restrictions
in USA were introduced later than in EU countries (see, e.g., [87]), many cases of
the disease could be undetected in USA in April 2020. The error could be reduced
with the use of fresher data sets. The time period between T c and t final is very long
(almost 5 months) in the case of USA. During this period, the characteristics of the
epidemic probably changed (due to changes in quarantine conditions and mass
protests in the summer of 2020), so the applied classical SIR theory (see Chap. 4)
and method of determining its parameters (proposed in Chap. 5) are not suitable for
adequate simulation of the situation in the USA. Probably, new COVID-19 epidemic waves started in this country before the first wave ended.
The great value of the error e calls into question the obtained estimates of the
characteristics of the epidemic. The average time of spreading infection s ¼ 1=q in
USA was estimated as 1.45 days. This value is higher than in Austria (0.77, prediction 6), France (0.82, prediction 2), and Germany (1.35, prediction 2), comparable with Italy (1.47, prediction 6) and Spain (1.46, prediction 2) and lower than in
the UK (3.03).
Table 6.17 First wave of the COVID-19 epidemic in USA
Number of prediction/optimal values of parameters,
characteristics
Prediction 1
n = 21
Period taken for calculations T c : April
9–29, 2020
N
7,082,400
m
6,312,894.63367680
a
1.08933738707e-07
t
Ã
1
−85.9627117094321
q
0.687687214511608
1=q
1.45414947216984
r
0.999378778826037
F, Eq. (2.9)
15,278.2115499352
F=F C ð1; n À 2Þ
1005.14549670626
S 1 , Eq. (4.9)
5,601,247
V 1 , Eq. (4.16)
1,481,153
t final , Eq. (4.17)
213.5
Final day of the first wave
September 22, 2020
V f , estimated from [86]
6,789,781
e, Eq. (4.20)
78.2%
Optimal values of parameters and other SIR model characteristics
70
6 SIR Simulations for the First Waves of the COVID-19 …