

The basic reproduction number R 0 can be calculated with the use of formula
(4.33) and the estimation of the doubling time s d = 2.31 days obtained in Chap. 2
using the assumption that the number of cases increased exponentially. With the use
of the estimation s ¼ 1=q = 1.454 days (see Table 6.17), Eq. (4.33) yields
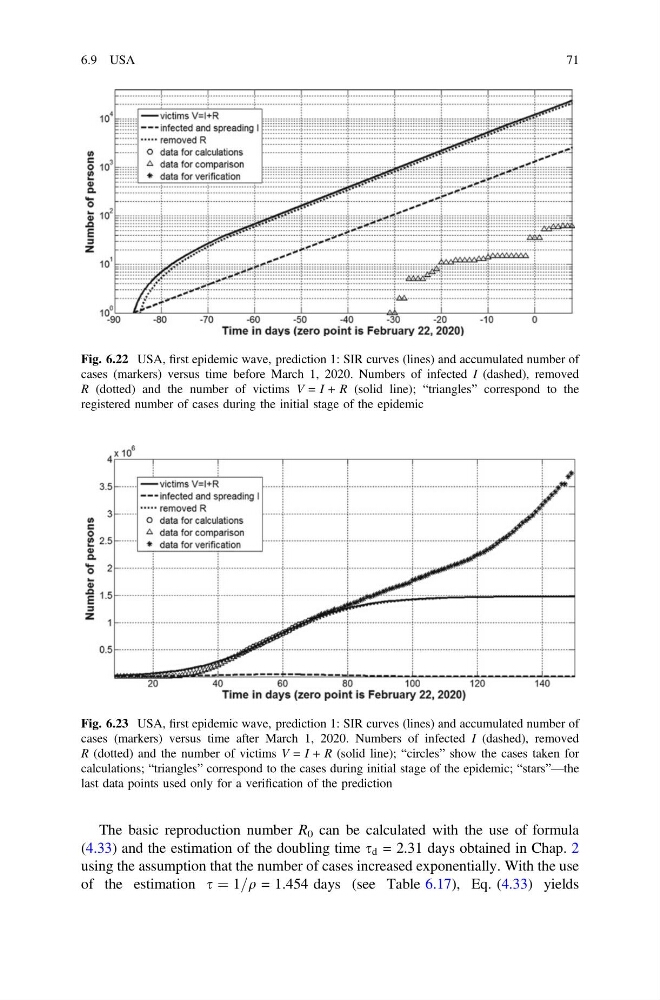
Fig. 6.22 USA, first epidemic wave, prediction 1: SIR curves (lines) and accumulated number of
cases (markers) versus time before March 1, 2020. Numbers of infected I (dashed), removed
R (dotted) and the number of victims V = I + R (solid line); “triangles” correspond to the
registered number of cases during the initial stage of the epidemic
Fig. 6.23 USA, first epidemic wave, prediction 1: SIR curves (lines) and accumulated number of
cases (markers) versus time after March 1, 2020. Numbers of infected I (dashed), removed
R (dotted) and the number of victims V = I + R (solid line); “circles” show the cases taken for
calculations; “triangles” correspond to the cases during initial stage of the epidemic; “stars”—the
last data points used only for a verification of the prediction
6.9 USA
71
(4.33) and the estimation of the doubling time s d = 2.31 days obtained in Chap. 2
using the assumption that the number of cases increased exponentially. With the use
of the estimation s ¼ 1=q = 1.454 days (see Table 6.17), Eq. (4.33) yields
Fig. 6.22 USA, first epidemic wave, prediction 1: SIR curves (lines) and accumulated number of
cases (markers) versus time before March 1, 2020. Numbers of infected I (dashed), removed
R (dotted) and the number of victims V = I + R (solid line); “triangles” correspond to the
registered number of cases during the initial stage of the epidemic
Fig. 6.23 USA, first epidemic wave, prediction 1: SIR curves (lines) and accumulated number of
cases (markers) versus time after March 1, 2020. Numbers of infected I (dashed), removed
R (dotted) and the number of victims V = I + R (solid line); “circles” show the cases taken for
calculations; “triangles” correspond to the cases during initial stage of the epidemic; “stars”—the
last data points used only for a verification of the prediction
6.9 USA
71