

Table 6.16 First wave of the COVID-19 epidemic in the UK
Number of prediction/optimal values
of parameters, characteristics
Prediction 1
n = 21
Period taken for calculations T c :
April 9–29, 2020
N
479,782.4
m
361,758.017613005
a
9.1371956639e-07
t
Ã
1
−47.0679605620665
q
0.330545378991741
1=q
3.02530322175518
r
0.999363727388945
F, Eq. (2.9)
14,916.4586251212
F=F C ð1; n À 2Þ
981.345962179029
S 1 , Eq. (4.9)
264,883
V 1 , Eq. (4.16)
214,899
t final , Eq. (4.17)
180.1
Final day of the first wave
August 20, 2020
V f , estimated from [86]
322,559
e, Eq. (4.20)
33.4%
Optimal values of parameters and other SIR model characteristics
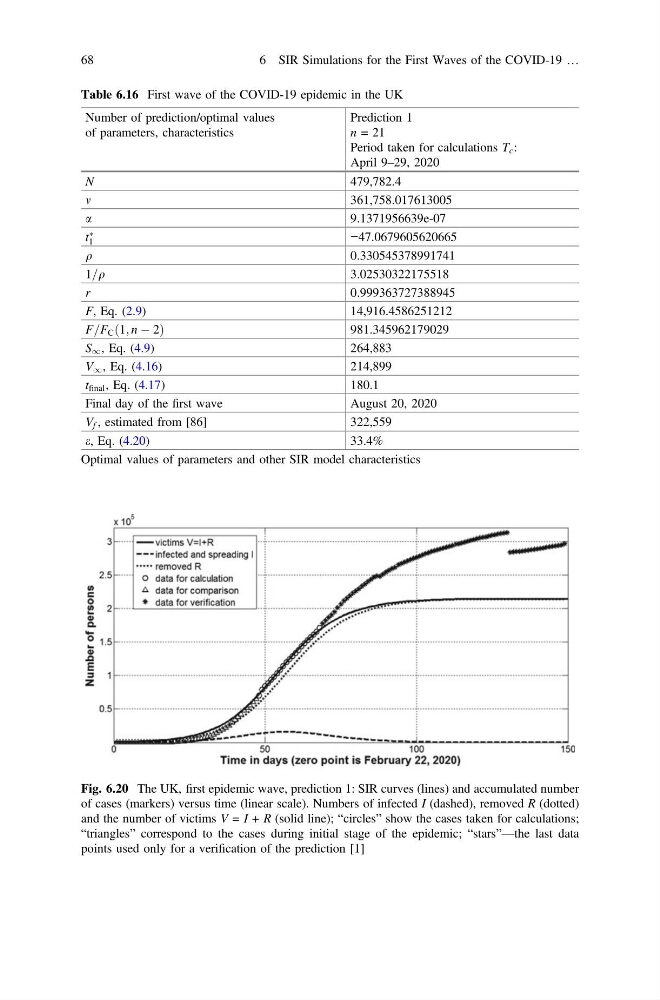
Fig. 6.20 The UK, first epidemic wave, prediction 1: SIR curves (lines) and accumulated number
of cases (markers) versus time (linear scale). Numbers of infected I (dashed), removed R (dotted)
and the number of victims V = I + R (solid line); “circles” show the cases taken for calculations;
“triangles” correspond to the cases during initial stage of the epidemic; “stars”—the last data
points used only for a verification of the prediction [1]
68
6 SIR Simulations for the First Waves of the COVID-19 …
Number of prediction/optimal values
of parameters, characteristics
Prediction 1
n = 21
Period taken for calculations T c :
April 9–29, 2020
N
479,782.4
m
361,758.017613005
a
9.1371956639e-07
t
Ã
1
−47.0679605620665
q
0.330545378991741
1=q
3.02530322175518
r
0.999363727388945
F, Eq. (2.9)
14,916.4586251212
F=F C ð1; n À 2Þ
981.345962179029
S 1 , Eq. (4.9)
264,883
V 1 , Eq. (4.16)
214,899
t final , Eq. (4.17)
180.1
Final day of the first wave
August 20, 2020
V f , estimated from [86]
322,559
e, Eq. (4.20)
33.4%
Optimal values of parameters and other SIR model characteristics
Fig. 6.20 The UK, first epidemic wave, prediction 1: SIR curves (lines) and accumulated number
of cases (markers) versus time (linear scale). Numbers of infected I (dashed), removed R (dotted)
and the number of victims V = I + R (solid line); “circles” show the cases taken for calculations;
“triangles” correspond to the cases during initial stage of the epidemic; “stars”—the last data
points used only for a verification of the prediction [1]
68
6 SIR Simulations for the First Waves of the COVID-19 …