

6.8 The UK
In this section, we consider the first wave of the COVID-19 epidemic in the UK and
present the results of a SIR simulation.
The SIR simulation for the COVID-19 epidemic dynamics in the UK was
performed with the use of V j and t j data sets presented in Table 6.3 for period of
time T c form April 9 to April 29, 2020, taken for calculations. The results are shown
in Table 6.16 and Figs. 6.6, 6.7, 6.20 and 6.21; some of them were published in
[75, 77]. The value V f was interpolated with the use of figures for accumulated
number of cases in the UK—324,605 (as of August 22, 2020) and weekly increase
7161 available in WHO report [82]. Unfortunately, WHO stopped to present daily
information after August 16, 2020.
Table 6.16 demonstrates high enough values of F=F C ð1; n À 2Þ and the correlation coefficient r (comparable with the presented estimations for the EU countries), but the relative error is much higher (e = 33.4%). As quarantine restrictions
in the UK were introduced later than in EU countries, many cases of the disease
could be undetected in the UK in April 2020. The average time of spreading
infection s ¼ 1=q in UK was estimated as 3.03 days. This value is much higher
than in the EU countries: Austria (0.77, prediction 4), France (0.82, prediction 2),
Germany (1.35, prediction 2), Italy (1.47, prediction 6), and Spain (1.46, prediction
2). This may also be the result of the later introduction of quarantine in the UK.
Figures 6.20 and 6.21 illustrate that the number of cases registered in the UK
after T c (“stars”) started to deviate from the theoretical V = I + R curve (solid line)
immediately after T c . The result of this behavior is the rather large value of the
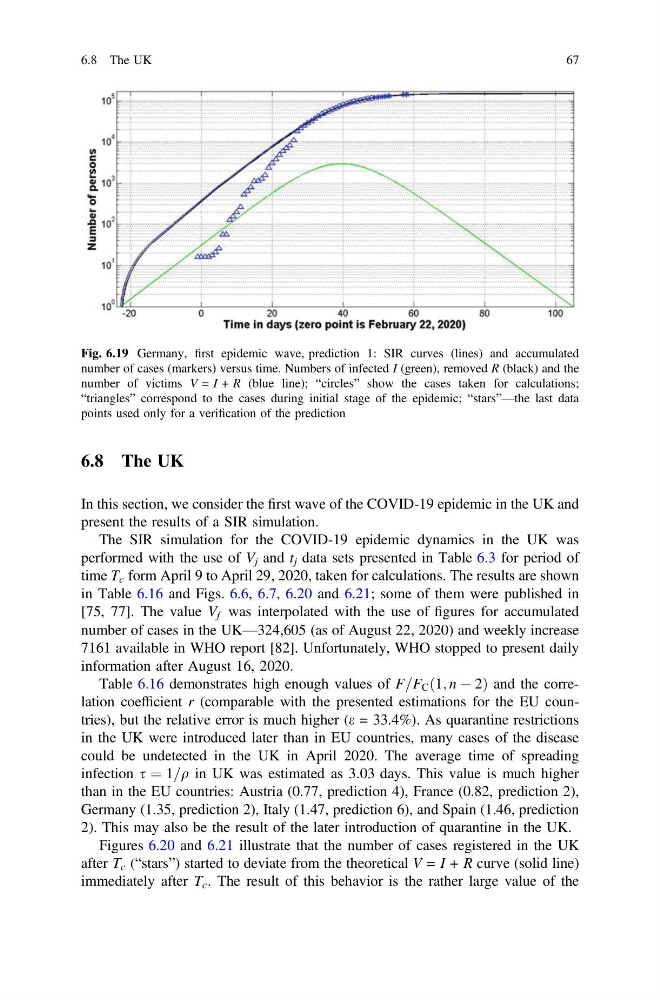
Fig. 6.19 Germany, first epidemic wave, prediction 1: SIR curves (lines) and accumulated
number of cases (markers) versus time. Numbers of infected I (green), removed R (black) and the
number of victims V = I + R (blue line); “circles” show the cases taken for calculations;
“triangles” correspond to the cases during initial stage of the epidemic; “stars”—the last data
points used only for a verification of the prediction
6.8 The UK
67
In this section, we consider the first wave of the COVID-19 epidemic in the UK and
present the results of a SIR simulation.
The SIR simulation for the COVID-19 epidemic dynamics in the UK was
performed with the use of V j and t j data sets presented in Table 6.3 for period of
time T c form April 9 to April 29, 2020, taken for calculations. The results are shown
in Table 6.16 and Figs. 6.6, 6.7, 6.20 and 6.21; some of them were published in
[75, 77]. The value V f was interpolated with the use of figures for accumulated
number of cases in the UK—324,605 (as of August 22, 2020) and weekly increase
7161 available in WHO report [82]. Unfortunately, WHO stopped to present daily
information after August 16, 2020.
Table 6.16 demonstrates high enough values of F=F C ð1; n À 2Þ and the correlation coefficient r (comparable with the presented estimations for the EU countries), but the relative error is much higher (e = 33.4%). As quarantine restrictions
in the UK were introduced later than in EU countries, many cases of the disease
could be undetected in the UK in April 2020. The average time of spreading
infection s ¼ 1=q in UK was estimated as 3.03 days. This value is much higher
than in the EU countries: Austria (0.77, prediction 4), France (0.82, prediction 2),
Germany (1.35, prediction 2), Italy (1.47, prediction 6), and Spain (1.46, prediction
2). This may also be the result of the later introduction of quarantine in the UK.
Figures 6.20 and 6.21 illustrate that the number of cases registered in the UK
after T c (“stars”) started to deviate from the theoretical V = I + R curve (solid line)
immediately after T c . The result of this behavior is the rather large value of the
Fig. 6.19 Germany, first epidemic wave, prediction 1: SIR curves (lines) and accumulated
number of cases (markers) versus time. Numbers of infected I (green), removed R (black) and the
number of victims V = I + R (blue line); “circles” show the cases taken for calculations;
“triangles” correspond to the cases during initial stage of the epidemic; “stars”—the last data
points used only for a verification of the prediction
6.8 The UK
67