

in Spain and Italy during the first epidemic waves. The SIR curves corresponding to
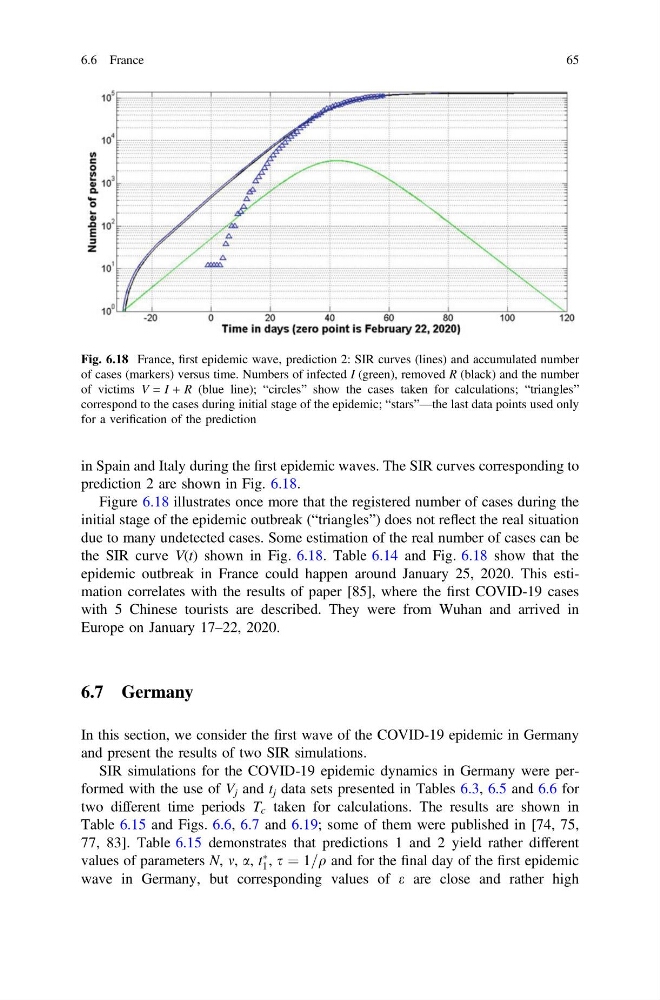
prediction 2 are shown in Fig. 6.18.
Figure 6.18 illustrates once more that the registered number of cases during the
initial stage of the epidemic outbreak (“triangles”) does not reflect the real situation
due to many undetected cases. Some estimation of the real number of cases can be
the SIR curve V(t) shown in Fig. 6.18. Table 6.14 and Fig. 6.18 show that the
epidemic outbreak in France could happen around January 25, 2020. This estimation correlates with the results of paper [85], where the first COVID-19 cases
with 5 Chinese tourists are described. They were from Wuhan and arrived in
Europe on January 17–22, 2020.
6.7 Germany
In this section, we consider the first wave of the COVID-19 epidemic in Germany
and present the results of two SIR simulations.
SIR simulations for the COVID-19 epidemic dynamics in Germany were performed with the use of V j and t j data sets presented in Tables 6.3, 6.5 and 6.6 for
two different time periods T c taken for calculations. The results are shown in
Table 6.15 and Figs. 6.6, 6.7 and 6.19; some of them were published in [74, 75,
77, 83]. Table 6.15 demonstrates that predictions 1 and 2 yield rather different
values of parameters N, m, a, t
Ã
1 , s ¼ 1=q and for the final day of the first epidemic
wave in Germany, but corresponding values of e are close and rather high
Fig. 6.18 France, first epidemic wave, prediction 2: SIR curves (lines) and accumulated number
of cases (markers) versus time. Numbers of infected I (green), removed R (black) and the number
of victims V = I + R (blue line); “circles” show the cases taken for calculations; “triangles”
correspond to the cases during initial stage of the epidemic; “stars”—the last data points used only
for a verification of the prediction
6.6 France
65
prediction 2 are shown in Fig. 6.18.
Figure 6.18 illustrates once more that the registered number of cases during the
initial stage of the epidemic outbreak (“triangles”) does not reflect the real situation
due to many undetected cases. Some estimation of the real number of cases can be
the SIR curve V(t) shown in Fig. 6.18. Table 6.14 and Fig. 6.18 show that the
epidemic outbreak in France could happen around January 25, 2020. This estimation correlates with the results of paper [85], where the first COVID-19 cases
with 5 Chinese tourists are described. They were from Wuhan and arrived in
Europe on January 17–22, 2020.
6.7 Germany
In this section, we consider the first wave of the COVID-19 epidemic in Germany
and present the results of two SIR simulations.
SIR simulations for the COVID-19 epidemic dynamics in Germany were performed with the use of V j and t j data sets presented in Tables 6.3, 6.5 and 6.6 for
two different time periods T c taken for calculations. The results are shown in
Table 6.15 and Figs. 6.6, 6.7 and 6.19; some of them were published in [74, 75,
77, 83]. Table 6.15 demonstrates that predictions 1 and 2 yield rather different
values of parameters N, m, a, t
Ã
1 , s ¼ 1=q and for the final day of the first epidemic
wave in Germany, but corresponding values of e are close and rather high
Fig. 6.18 France, first epidemic wave, prediction 2: SIR curves (lines) and accumulated number
of cases (markers) versus time. Numbers of infected I (green), removed R (black) and the number
of victims V = I + R (blue line); “circles” show the cases taken for calculations; “triangles”
correspond to the cases during initial stage of the epidemic; “stars”—the last data points used only
for a verification of the prediction
6.6 France
65