

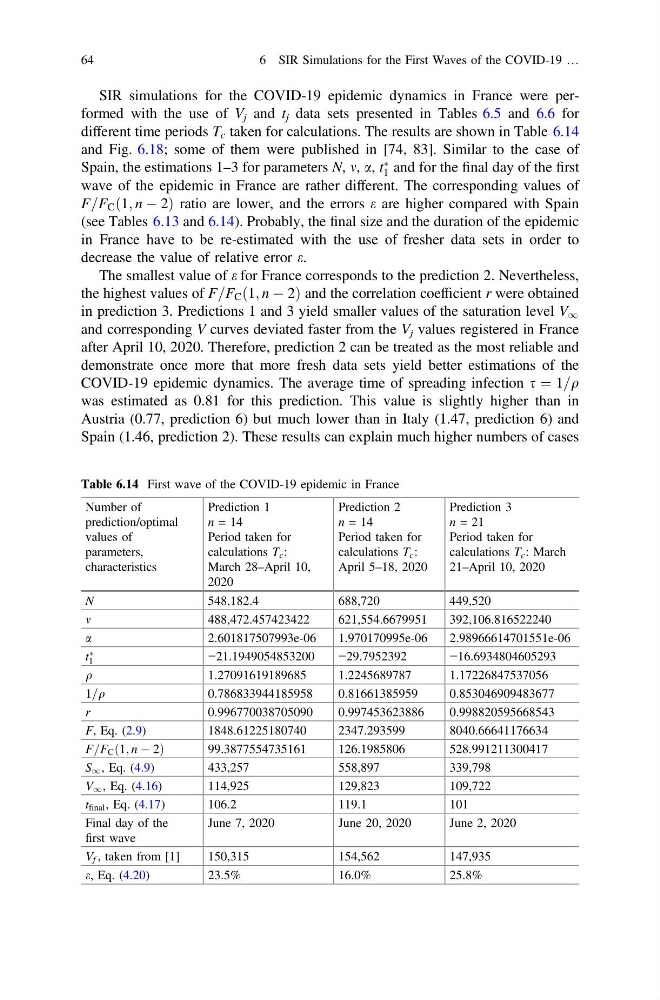
SIR simulations for the COVID-19 epidemic dynamics in France were performed with the use of V j and t j data sets presented in Tables 6.5 and 6.6 for
different time periods T c taken for calculations. The results are shown in Table 6.14
and Fig. 6.18; some of them were published in [74, 83]. Similar to the case of
Spain, the estimations 1–3 for parameters N, m, a, t
Ã
1 and for the final day of the first
wave of the epidemic in France are rather different. The corresponding values of
F=F C ð1; n À 2Þ ratio are lower, and the errors e are higher compared with Spain
(see Tables 6.13 and 6.14). Probably, the final size and the duration of the epidemic
in France have to be re-estimated with the use of fresher data sets in order to
decrease the value of relative error e.
The smallest value of e for France corresponds to the prediction 2. Nevertheless,
the highest values of F=F C ð1; n À 2Þ and the correlation coefficient r were obtained
in prediction 3. Predictions 1 and 3 yield smaller values of the saturation level V 1
and corresponding V curves deviated faster from the V j values registered in France
after April 10, 2020. Therefore, prediction 2 can be treated as the most reliable and
demonstrate once more that more fresh data sets yield better estimations of the
COVID-19 epidemic dynamics. The average time of spreading infection s ¼ 1=q
was estimated as 0.81 for this prediction. This value is slightly higher than in
Austria (0.77, prediction 6) but much lower than in Italy (1.47, prediction 6) and
Spain (1.46, prediction 2). These results can explain much higher numbers of cases
Table 6.14 First wave of the COVID-19 epidemic in France
Number of
prediction/optimal
values of
parameters,
characteristics
Prediction 1
n = 14
Period taken for
calculations T c :
March 28–April 10,
2020
Prediction 2
n = 14
Period taken for
calculations T c :
April 5–18, 2020
Prediction 3
n = 21
Period taken for
calculations T c : March
21–April 10, 2020
N
548,182.4
688,720
449,520
m
488,472.457423422
621,554.6679951
392,106.816522240
a
2.601817507993e-06
1.970170995e-06
2.98966614701551e-06
t
Ã
1
−21.1949054853200
−29.7952392
−16.6934804605293
q
1.27091619189685
1.2245689787
1.17226847537056
1=q
0.786833944185958
0.81661385959
0.853046909483677
r
0.996770038705090
0.997453623886
0.998820595668543
F, Eq. (2.9)
1848.61225180740
2347.293599
8040.66641176634
F=F C ð1; n À 2Þ
99.3877554735161
126.1985806
528.991211300417
S 1 , Eq. (4.9)
433,257
558,897
339,798
V 1 , Eq. (4.16)
114,925
129,823
109,722
t final , Eq. (4.17)
106.2
119.1
101
Final day of the
first wave
June 7, 2020
June 20, 2020
June 2, 2020
V f , taken from [1]
150,315
154,562
147,935
e, Eq. (4.20)
23.5%
16.0%
25.8%
64
6 SIR Simulations for the First Waves of the COVID-19 …
different time periods T c taken for calculations. The results are shown in Table 6.14
and Fig. 6.18; some of them were published in [74, 83]. Similar to the case of
Spain, the estimations 1–3 for parameters N, m, a, t
Ã
1 and for the final day of the first
wave of the epidemic in France are rather different. The corresponding values of
F=F C ð1; n À 2Þ ratio are lower, and the errors e are higher compared with Spain
(see Tables 6.13 and 6.14). Probably, the final size and the duration of the epidemic
in France have to be re-estimated with the use of fresher data sets in order to
decrease the value of relative error e.
The smallest value of e for France corresponds to the prediction 2. Nevertheless,
the highest values of F=F C ð1; n À 2Þ and the correlation coefficient r were obtained
in prediction 3. Predictions 1 and 3 yield smaller values of the saturation level V 1
and corresponding V curves deviated faster from the V j values registered in France
after April 10, 2020. Therefore, prediction 2 can be treated as the most reliable and
demonstrate once more that more fresh data sets yield better estimations of the
COVID-19 epidemic dynamics. The average time of spreading infection s ¼ 1=q
was estimated as 0.81 for this prediction. This value is slightly higher than in
Austria (0.77, prediction 6) but much lower than in Italy (1.47, prediction 6) and
Spain (1.46, prediction 2). These results can explain much higher numbers of cases
Table 6.14 First wave of the COVID-19 epidemic in France
Number of
prediction/optimal
values of
parameters,
characteristics
Prediction 1
n = 14
Period taken for
calculations T c :
March 28–April 10,
2020
Prediction 2
n = 14
Period taken for
calculations T c :
April 5–18, 2020
Prediction 3
n = 21
Period taken for
calculations T c : March
21–April 10, 2020
N
548,182.4
688,720
449,520
m
488,472.457423422
621,554.6679951
392,106.816522240
a
2.601817507993e-06
1.970170995e-06
2.98966614701551e-06
t
Ã
1
−21.1949054853200
−29.7952392
−16.6934804605293
q
1.27091619189685
1.2245689787
1.17226847537056
1=q
0.786833944185958
0.81661385959
0.853046909483677
r
0.996770038705090
0.997453623886
0.998820595668543
F, Eq. (2.9)
1848.61225180740
2347.293599
8040.66641176634
F=F C ð1; n À 2Þ
99.3877554735161
126.1985806
528.991211300417
S 1 , Eq. (4.9)
433,257
558,897
339,798
V 1 , Eq. (4.16)
114,925
129,823
109,722
t final , Eq. (4.17)
106.2
119.1
101
Final day of the
first wave
June 7, 2020
June 20, 2020
June 2, 2020
V f , taken from [1]
150,315
154,562
147,935
e, Eq. (4.20)
23.5%
16.0%
25.8%
64
6 SIR Simulations for the First Waves of the COVID-19 …