

Table 6.13 First wave of the COVID-19 epidemic in Spain
Number of prediction/
optimal values of
parameters,
characteristics
Prediction 1
n = 14
Period taken for
calculations T c :
March 28–April 10,
2020
Prediction 2
n = 21
Period taken for
calculations T c :
March 29–April
18, 2020
Prediction 3
n = 21
Period taken for
calculations T c :
March 21–April
10, 2020
N
736,000
760,152.448
846,400
m
636,763.648
643,334.866338
753,918.9504
a
1.6891621445e-06
1.06816546e-06
2.1002309431e-06
t
Ã
1
−22.8563373560822
−43.8057685
−13.66667768349
q
1.07559704919762
0.6871880836
1.58340390824
1=q
0.929716198780932
1.455205676
0.6315507968569
r
0.999378854391215
0.997926053
0.9991898592234
F, Eq. (2.9)
9650.57175588669
4566.3928836
11,712.108966599
F=F C ð1; n À 2Þ
518.847943864876
300.420584
770.53348464470
S 1 , Eq. (4.9)
546,870
539,142
668,426
V 1 , Eq. (4.16)
189,130
221,011
177,974
t final , Eq. (4.17)
105.6
135.3
93
Final day of the first
wave
June 7, 2020
July 7, 2020
May 25, 2020
V f , taken from [1]
241,550
252,130
235,400
e, Eq. (4.20)
21.7%
12.3%
24.4%
Optimal values of parameters and other SIR model characteristics for different predictions
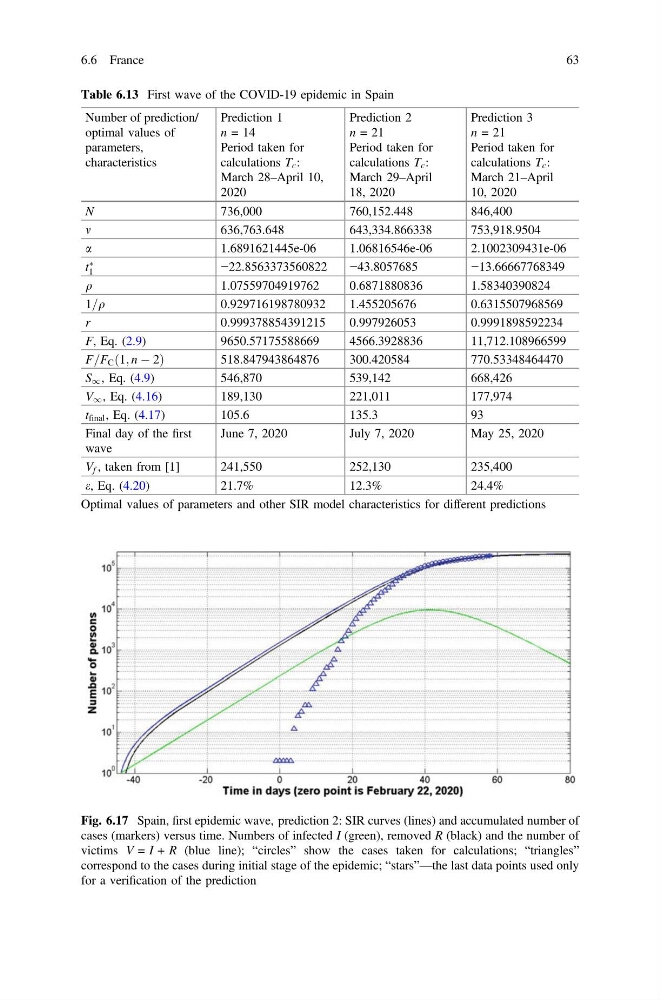
Fig. 6.17 Spain, first epidemic wave, prediction 2: SIR curves (lines) and accumulated number of
cases (markers) versus time. Numbers of infected I (green), removed R (black) and the number of
victims V = I + R (blue line); “circles” show the cases taken for calculations; “triangles”
correspond to the cases during initial stage of the epidemic; “stars”—the last data points used only
for a verification of the prediction
6.6 France
63
Number of prediction/
optimal values of
parameters,
characteristics
Prediction 1
n = 14
Period taken for
calculations T c :
March 28–April 10,
2020
Prediction 2
n = 21
Period taken for
calculations T c :
March 29–April
18, 2020
Prediction 3
n = 21
Period taken for
calculations T c :
March 21–April
10, 2020
N
736,000
760,152.448
846,400
m
636,763.648
643,334.866338
753,918.9504
a
1.6891621445e-06
1.06816546e-06
2.1002309431e-06
t
Ã
1
−22.8563373560822
−43.8057685
−13.66667768349
q
1.07559704919762
0.6871880836
1.58340390824
1=q
0.929716198780932
1.455205676
0.6315507968569
r
0.999378854391215
0.997926053
0.9991898592234
F, Eq. (2.9)
9650.57175588669
4566.3928836
11,712.108966599
F=F C ð1; n À 2Þ
518.847943864876
300.420584
770.53348464470
S 1 , Eq. (4.9)
546,870
539,142
668,426
V 1 , Eq. (4.16)
189,130
221,011
177,974
t final , Eq. (4.17)
105.6
135.3
93
Final day of the first
wave
June 7, 2020
July 7, 2020
May 25, 2020
V f , taken from [1]
241,550
252,130
235,400
e, Eq. (4.20)
21.7%
12.3%
24.4%
Optimal values of parameters and other SIR model characteristics for different predictions
Fig. 6.17 Spain, first epidemic wave, prediction 2: SIR curves (lines) and accumulated number of
cases (markers) versus time. Numbers of infected I (green), removed R (black) and the number of
victims V = I + R (blue line); “circles” show the cases taken for calculations; “triangles”
correspond to the cases during initial stage of the epidemic; “stars”—the last data points used only
for a verification of the prediction
6.6 France
63