

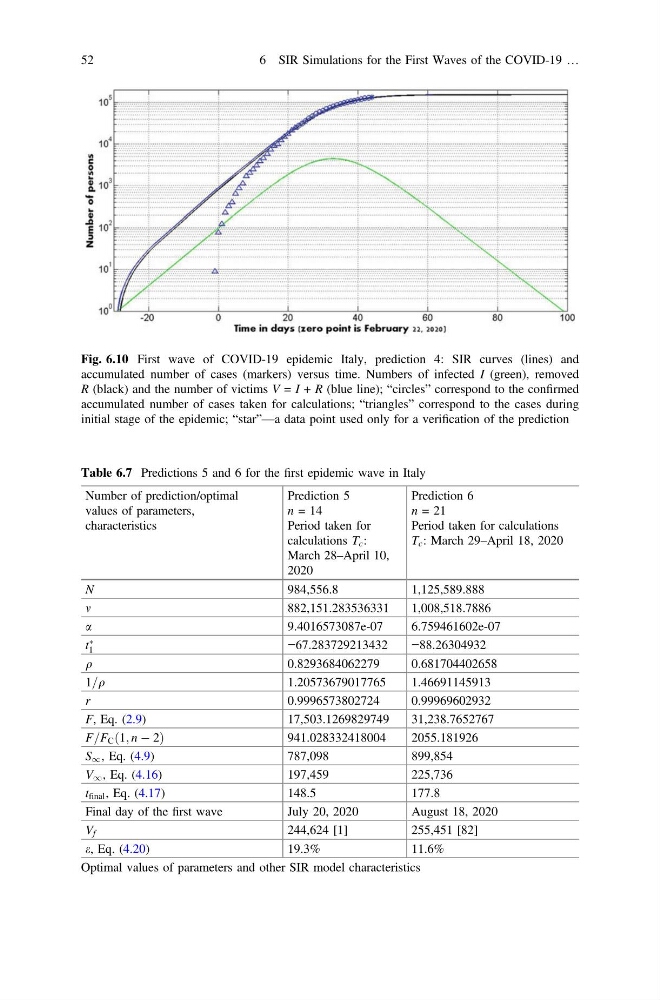
Fig. 6.10 First wave of COVID-19 epidemic Italy, prediction 4: SIR curves (lines) and
accumulated number of cases (markers) versus time. Numbers of infected I (green), removed
R (black) and the number of victims V = I + R (blue line); “circles” correspond to the confirmed
accumulated number of cases taken for calculations; “triangles” correspond to the cases during
initial stage of the epidemic; “star”—a data point used only for a verification of the prediction
Table 6.7 Predictions 5 and 6 for the first epidemic wave in Italy
Number of prediction/optimal
values of parameters,
characteristics
Prediction 5
n = 14
Period taken for
calculations T c :
March 28–April 10,
2020
Prediction 6
n = 21
Period taken for calculations
T c : March 29–April 18, 2020
N
984,556.8
1,125,589.888
m
882,151.283536331
1,008,518.7886
a
9.4016573087e-07
6.759461602e-07
t
Ã
1
−67.283729213432
−88.26304932
q
0.8293684062279
0.681704402658
1=q
1.20573679017765
1.46691145913
r
0.9996573802724
0.99969602932
F, Eq. (2.9)
17,503.1269829749
31,238.7652767
F=F C ð1; n À 2Þ
941.028332418004
2055.181926
S 1 , Eq. (4.9)
787,098
899,854
V 1 , Eq. (4.16)
197,459
225,736
t final , Eq. (4.17)
148.5
177.8
Final day of the first wave
July 20, 2020
August 18, 2020
V f
244,624 [1]
255,451 [82]
e, Eq. (4.20)
19.3%
11.6%
Optimal values of parameters and other SIR model characteristics
52
6 SIR Simulations for the First Waves of the COVID-19 …
accumulated number of cases (markers) versus time. Numbers of infected I (green), removed
R (black) and the number of victims V = I + R (blue line); “circles” correspond to the confirmed
accumulated number of cases taken for calculations; “triangles” correspond to the cases during
initial stage of the epidemic; “star”—a data point used only for a verification of the prediction
Table 6.7 Predictions 5 and 6 for the first epidemic wave in Italy
Number of prediction/optimal
values of parameters,
characteristics
Prediction 5
n = 14
Period taken for
calculations T c :
March 28–April 10,
2020
Prediction 6
n = 21
Period taken for calculations
T c : March 29–April 18, 2020
N
984,556.8
1,125,589.888
m
882,151.283536331
1,008,518.7886
a
9.4016573087e-07
6.759461602e-07
t
Ã
1
−67.283729213432
−88.26304932
q
0.8293684062279
0.681704402658
1=q
1.20573679017765
1.46691145913
r
0.9996573802724
0.99969602932
F, Eq. (2.9)
17,503.1269829749
31,238.7652767
F=F C ð1; n À 2Þ
941.028332418004
2055.181926
S 1 , Eq. (4.9)
787,098
899,854
V 1 , Eq. (4.16)
197,459
225,736
t final , Eq. (4.17)
148.5
177.8
Final day of the first wave
July 20, 2020
August 18, 2020
V f
244,624 [1]
255,451 [82]
e, Eq. (4.20)
19.3%
11.6%
Optimal values of parameters and other SIR model characteristics
52
6 SIR Simulations for the First Waves of the COVID-19 …