

and the first wave of the epidemic can stop only after August 18, 2020 (see
Table 6.7, prediction 6). New estimations of the relative error e are much lower
than presented in Table 6.4. The reliability of prediction 6 is very high, because for
four months of monitoring the epidemic in Italy (this forecast was posted on April
22, 2020 [83]) the real number of cases exceeded the estimated saturation level
V 1 ¼ 225; 736 by only 11.6%. The higher error of the previous calculations can be
explained by the fact that they used data from earlier periods, when not all cases of
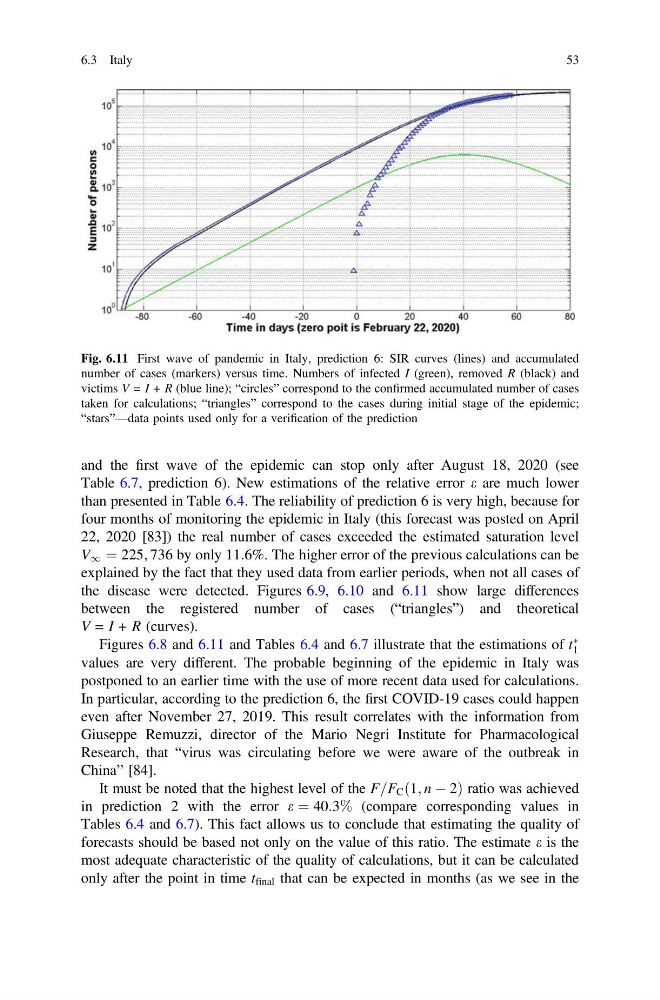
the disease were detected. Figures 6.9, 6.10 and 6.11 show large differences
between the registered number of cases (“triangles”) and theoretical
V = I + R (curves).
Figures 6.8 and 6.11 and Tables 6.4 and 6.7 illustrate that the estimations of t
Ã
1
values are very different. The probable beginning of the epidemic in Italy was
postponed to an earlier time with the use of more recent data used for calculations.
In particular, according to the prediction 6, the first COVID-19 cases could happen
even after November 27, 2019. This result correlates with the information from
Giuseppe Remuzzi, director of the Mario Negri Institute for Pharmacological
Research, that “virus was circulating before we were aware of the outbreak in
China” [84].
It must be noted that the highest level of the F=F C ð1; n À 2Þ ratio was achieved
in prediction 2 with the error e ¼ 40:3% (compare corresponding values in
Tables 6.4 and 6.7). This fact allows us to conclude that estimating the quality of
forecasts should be based not only on the value of this ratio. The estimate e is the
most adequate characteristic of the quality of calculations, but it can be calculated
only after the point in time t final that can be expected in months (as we see in the
Fig. 6.11 First wave of pandemic in Italy, prediction 6: SIR curves (lines) and accumulated
number of cases (markers) versus time. Numbers of infected I (green), removed R (black) and
victims V = I + R (blue line); “circles” correspond to the confirmed accumulated number of cases
taken for calculations; “triangles” correspond to the cases during initial stage of the epidemic;
“stars”—data points used only for a verification of the prediction
6.3 Italy
53
Table 6.7, prediction 6). New estimations of the relative error e are much lower
than presented in Table 6.4. The reliability of prediction 6 is very high, because for
four months of monitoring the epidemic in Italy (this forecast was posted on April
22, 2020 [83]) the real number of cases exceeded the estimated saturation level
V 1 ¼ 225; 736 by only 11.6%. The higher error of the previous calculations can be
explained by the fact that they used data from earlier periods, when not all cases of
the disease were detected. Figures 6.9, 6.10 and 6.11 show large differences
between the registered number of cases (“triangles”) and theoretical
V = I + R (curves).
Figures 6.8 and 6.11 and Tables 6.4 and 6.7 illustrate that the estimations of t
Ã
1
values are very different. The probable beginning of the epidemic in Italy was
postponed to an earlier time with the use of more recent data used for calculations.
In particular, according to the prediction 6, the first COVID-19 cases could happen
even after November 27, 2019. This result correlates with the information from
Giuseppe Remuzzi, director of the Mario Negri Institute for Pharmacological
Research, that “virus was circulating before we were aware of the outbreak in
China” [84].
It must be noted that the highest level of the F=F C ð1; n À 2Þ ratio was achieved
in prediction 2 with the error e ¼ 40:3% (compare corresponding values in
Tables 6.4 and 6.7). This fact allows us to conclude that estimating the quality of
forecasts should be based not only on the value of this ratio. The estimate e is the
most adequate characteristic of the quality of calculations, but it can be calculated
only after the point in time t final that can be expected in months (as we see in the
Fig. 6.11 First wave of pandemic in Italy, prediction 6: SIR curves (lines) and accumulated
number of cases (markers) versus time. Numbers of infected I (green), removed R (black) and
victims V = I + R (blue line); “circles” correspond to the confirmed accumulated number of cases
taken for calculations; “triangles” correspond to the cases during initial stage of the epidemic;
“stars”—data points used only for a verification of the prediction
6.3 Italy
53