

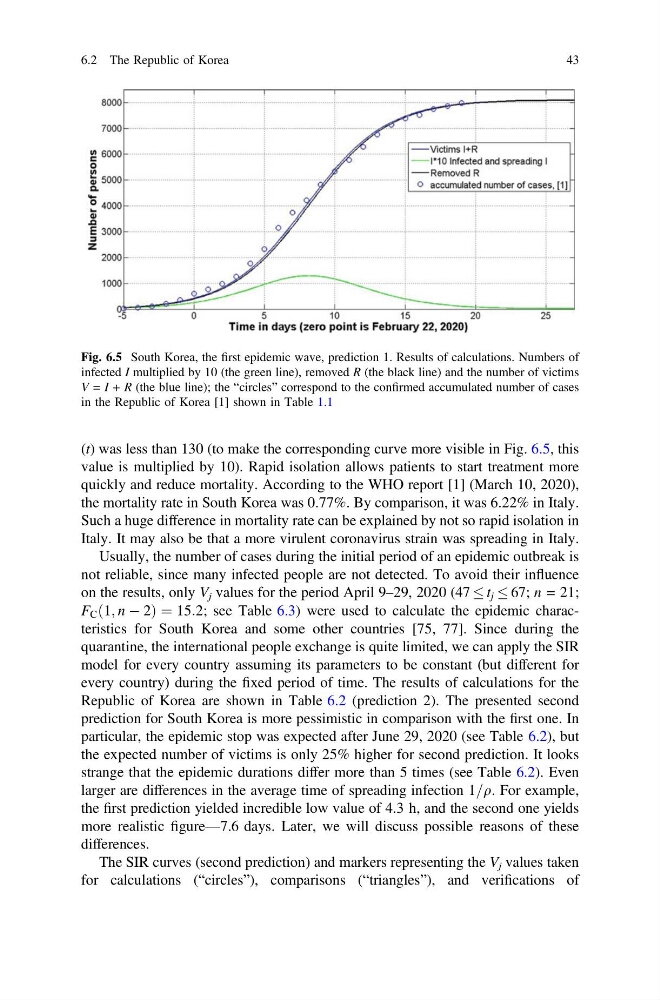
(t) was less than 130 (to make the corresponding curve more visible in Fig. 6.5, this
value is multiplied by 10). Rapid isolation allows patients to start treatment more
quickly and reduce mortality. According to the WHO report [1] (March 10, 2020),
the mortality rate in South Korea was 0.77%. By comparison, it was 6.22% in Italy.
Such a huge difference in mortality rate can be explained by not so rapid isolation in
Italy. It may also be that a more virulent coronavirus strain was spreading in Italy.
Usually, the number of cases during the initial period of an epidemic outbreak is
not reliable, since many infected people are not detected. To avoid their influence
on the results, only V j values for the period April 9–29, 2020 (47 t j 67; n = 21;
F C ð1; n À 2Þ ¼ 15:2; see Table 6.3) were used to calculate the epidemic characteristics for South Korea and some other countries [75, 77]. Since during the
quarantine, the international people exchange is quite limited, we can apply the SIR
model for every country assuming its parameters to be constant (but different for
every country) during the fixed period of time. The results of calculations for the
Republic of Korea are shown in Table 6.2 (prediction 2). The presented second
prediction for South Korea is more pessimistic in comparison with the first one. In
particular, the epidemic stop was expected after June 29, 2020 (see Table 6.2), but
the expected number of victims is only 25% higher for second prediction. It looks
strange that the epidemic durations differ more than 5 times (see Table 6.2). Even
larger are differences in the average time of spreading infection 1=q. For example,
the first prediction yielded incredible low value of 4.3 h, and the second one yields
more realistic figure—7.6 days. Later, we will discuss possible reasons of these
differences.
The SIR curves (second prediction) and markers representing the V j values taken
for calculations (“circles”), comparisons (“triangles”), and verifications of
Fig. 6.5 South Korea, the first epidemic wave, prediction 1. Results of calculations. Numbers of
infected I multiplied by 10 (the green line), removed R (the black line) and the number of victims
V = I + R (the blue line); the “circles” correspond to the confirmed accumulated number of cases
in the Republic of Korea [1] shown in Table 1.1
6.2 The Republic of Korea
43
value is multiplied by 10). Rapid isolation allows patients to start treatment more
quickly and reduce mortality. According to the WHO report [1] (March 10, 2020),
the mortality rate in South Korea was 0.77%. By comparison, it was 6.22% in Italy.
Such a huge difference in mortality rate can be explained by not so rapid isolation in
Italy. It may also be that a more virulent coronavirus strain was spreading in Italy.
Usually, the number of cases during the initial period of an epidemic outbreak is
not reliable, since many infected people are not detected. To avoid their influence
on the results, only V j values for the period April 9–29, 2020 (47 t j 67; n = 21;
F C ð1; n À 2Þ ¼ 15:2; see Table 6.3) were used to calculate the epidemic characteristics for South Korea and some other countries [75, 77]. Since during the
quarantine, the international people exchange is quite limited, we can apply the SIR
model for every country assuming its parameters to be constant (but different for
every country) during the fixed period of time. The results of calculations for the
Republic of Korea are shown in Table 6.2 (prediction 2). The presented second
prediction for South Korea is more pessimistic in comparison with the first one. In
particular, the epidemic stop was expected after June 29, 2020 (see Table 6.2), but
the expected number of victims is only 25% higher for second prediction. It looks
strange that the epidemic durations differ more than 5 times (see Table 6.2). Even
larger are differences in the average time of spreading infection 1=q. For example,
the first prediction yielded incredible low value of 4.3 h, and the second one yields
more realistic figure—7.6 days. Later, we will discuss possible reasons of these
differences.
The SIR curves (second prediction) and markers representing the V j values taken
for calculations (“circles”), comparisons (“triangles”), and verifications of
Fig. 6.5 South Korea, the first epidemic wave, prediction 1. Results of calculations. Numbers of
infected I multiplied by 10 (the green line), removed R (the black line) and the number of victims
V = I + R (the blue line); the “circles” correspond to the confirmed accumulated number of cases
in the Republic of Korea [1] shown in Table 1.1
6.2 The Republic of Korea
43