

accuracy; we can use information on the accumulated number of cases V f recorded
in the day, which corresponds to t final . The corresponding values from [1] are shown
in Table 6.1. Then, the accuracy e can be estimated with the use of formula (4.20).
The values presented in Table 6.1 demonstrate that the accuracy of the first prediction is rather bad (this is not surprising, as incomplete information on the number
of cases was used for the calculations). But the second prediction came true with
great accuracy (e ¼ 3:8%). As of September 26, 2020, the number of COVID-19
cases in China reached the number 90,966 [52]. It means that for almost 7 months
of observation of the epidemic (the second prediction was posted on March 4,
2020), the revealed exceeding the forecast level was only 11%.
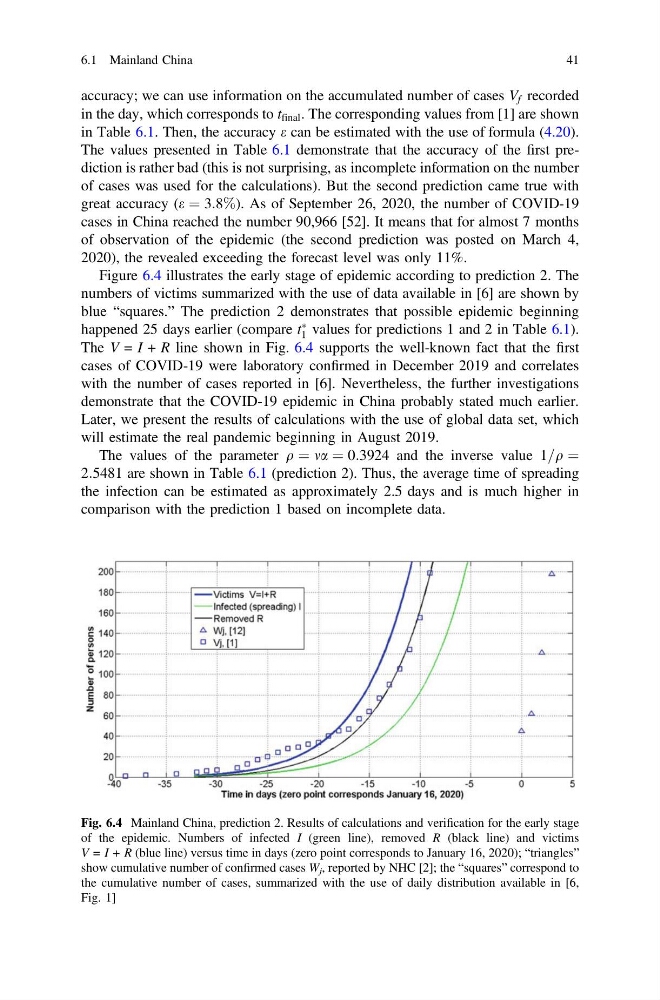
Figure 6.4 illustrates the early stage of epidemic according to prediction 2. The
numbers of victims summarized with the use of data available in [6] are shown by
blue “squares.” The prediction 2 demonstrates that possible epidemic beginning
happened 25 days earlier (compare t
Ã
1 values for predictions 1 and 2 in Table 6.1).
The V = I + R line shown in Fig. 6.4 supports the well-known fact that the first
cases of COVID-19 were laboratory confirmed in December 2019 and correlates
with the number of cases reported in [6]. Nevertheless, the further investigations
demonstrate that the COVID-19 epidemic in China probably stated much earlier.
Later, we present the results of calculations with the use of global data set, which
will estimate the real pandemic beginning in August 2019.
The values of the parameter q ¼ ma ¼ 0:3924 and the inverse value 1=q ¼
2:5481 are shown in Table 6.1 (prediction 2). Thus, the average time of spreading
the infection can be estimated as approximately 2.5 days and is much higher in
comparison with the prediction 1 based on incomplete data.
Fig. 6.4 Mainland China, prediction 2. Results of calculations and verification for the early stage
of the epidemic. Numbers of infected I (green line), removed R (black line) and victims
V = I + R (blue line) versus time in days (zero point corresponds to January 16, 2020); “triangles”
show cumulative number of confirmed cases W j , reported by NHC [2]; the “squares” correspond to
the cumulative number of cases, summarized with the use of daily distribution available in [6,
Fig. 1]
6.1 Mainland China
41
in the day, which corresponds to t final . The corresponding values from [1] are shown
in Table 6.1. Then, the accuracy e can be estimated with the use of formula (4.20).
The values presented in Table 6.1 demonstrate that the accuracy of the first prediction is rather bad (this is not surprising, as incomplete information on the number
of cases was used for the calculations). But the second prediction came true with
great accuracy (e ¼ 3:8%). As of September 26, 2020, the number of COVID-19
cases in China reached the number 90,966 [52]. It means that for almost 7 months
of observation of the epidemic (the second prediction was posted on March 4,
2020), the revealed exceeding the forecast level was only 11%.
Figure 6.4 illustrates the early stage of epidemic according to prediction 2. The
numbers of victims summarized with the use of data available in [6] are shown by
blue “squares.” The prediction 2 demonstrates that possible epidemic beginning
happened 25 days earlier (compare t
Ã
1 values for predictions 1 and 2 in Table 6.1).
The V = I + R line shown in Fig. 6.4 supports the well-known fact that the first
cases of COVID-19 were laboratory confirmed in December 2019 and correlates
with the number of cases reported in [6]. Nevertheless, the further investigations
demonstrate that the COVID-19 epidemic in China probably stated much earlier.
Later, we present the results of calculations with the use of global data set, which
will estimate the real pandemic beginning in August 2019.
The values of the parameter q ¼ ma ¼ 0:3924 and the inverse value 1=q ¼
2:5481 are shown in Table 6.1 (prediction 2). Thus, the average time of spreading
the infection can be estimated as approximately 2.5 days and is much higher in
comparison with the prediction 1 based on incomplete data.
Fig. 6.4 Mainland China, prediction 2. Results of calculations and verification for the early stage
of the epidemic. Numbers of infected I (green line), removed R (black line) and victims
V = I + R (blue line) versus time in days (zero point corresponds to January 16, 2020); “triangles”
show cumulative number of confirmed cases W j , reported by NHC [2]; the “squares” correspond to
the cumulative number of cases, summarized with the use of daily distribution available in [6,
Fig. 1]
6.1 Mainland China
41