

V = I + R and is in good agreement with “tested confirmed cases” W j , reported by
National Health Commission (NHC) of the People’s Republic of China [2].
One can imagine the excitement with which the author expected new reports
from NHC in order to verify the results of calculations. The waiting process even
became the subject of a separate preprint [68]. Unfortunately, many cases have not
be included in the official counts and have appeared in the official table from [2]
only on February 12 as “clinically diagnosed cases” Q j (see Table 1.2 and Fig. 1.1).
Since NHC has proposed two different ways of registration of the same disease [2],
V j must be the sum of W j and Q j , i.e., V j = W j + Q j (provided that no new methods
of registering the same disease would appear). Values W j after February 9 are
shown in Fig. 6.2 by “stars.” “Crosses” represent the sum W j + Q j.
Since the optimal curve was obtained only with the use of W j and the difference
between W j and V j is very big (e.g., it was 12,289 persons on February 12, 2020),
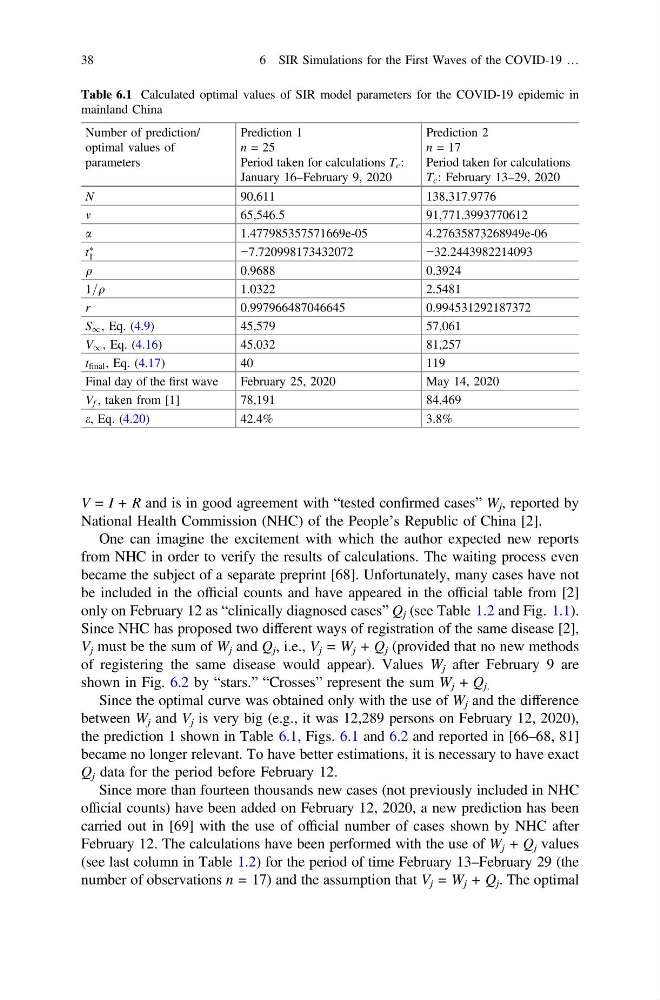
the prediction 1 shown in Table 6.1, Figs. 6.1 and 6.2 and reported in [66–68, 81]
became no longer relevant. To have better estimations, it is necessary to have exact
Q j data for the period before February 12.
Since more than fourteen thousands new cases (not previously included in NHC
official counts) have been added on February 12, 2020, a new prediction has been
carried out in [69] with the use of official number of cases shown by NHC after
February 12. The calculations have been performed with the use of W j + Q j values
(see last column in Table 1.2) for the period of time February 13–February 29 (the
number of observations n = 17) and the assumption that V j = W j + Q j . The optimal
Table 6.1 Calculated optimal values of SIR model parameters for the COVID-19 epidemic in
mainland China
Number of prediction/
optimal values of
parameters
Prediction 1
n = 25
Period taken for calculations T c :
January 16–February 9, 2020
Prediction 2
n = 17
Period taken for calculations
T c : February 13–29, 2020
N
90,611
138,317.9776
m
65,546.5
91,771.3993770612
a
1.477985357571669e-05
4.27635873268949e-06
t
Ã
1
−7.720998173432072
−32.2443982214093
q
0.9688
0.3924
1=q
1.0322
2.5481
r
0.997966487046645
0.994531292187372
S 1 , Eq. (4.9)
45,579
57,061
V 1 , Eq. (4.16)
45,032
81,257
t final , Eq. (4.17)
40
119
Final day of the first wave
February 25, 2020
May 14, 2020
V f , taken from [1]
78,191
84,469
e, Eq. (4.20)
42.4%
3.8%
38
6 SIR Simulations for the First Waves of the COVID-19 …
National Health Commission (NHC) of the People’s Republic of China [2].
One can imagine the excitement with which the author expected new reports
from NHC in order to verify the results of calculations. The waiting process even
became the subject of a separate preprint [68]. Unfortunately, many cases have not
be included in the official counts and have appeared in the official table from [2]
only on February 12 as “clinically diagnosed cases” Q j (see Table 1.2 and Fig. 1.1).
Since NHC has proposed two different ways of registration of the same disease [2],
V j must be the sum of W j and Q j , i.e., V j = W j + Q j (provided that no new methods
of registering the same disease would appear). Values W j after February 9 are
shown in Fig. 6.2 by “stars.” “Crosses” represent the sum W j + Q j.
Since the optimal curve was obtained only with the use of W j and the difference
between W j and V j is very big (e.g., it was 12,289 persons on February 12, 2020),
the prediction 1 shown in Table 6.1, Figs. 6.1 and 6.2 and reported in [66–68, 81]
became no longer relevant. To have better estimations, it is necessary to have exact
Q j data for the period before February 12.
Since more than fourteen thousands new cases (not previously included in NHC
official counts) have been added on February 12, 2020, a new prediction has been
carried out in [69] with the use of official number of cases shown by NHC after
February 12. The calculations have been performed with the use of W j + Q j values
(see last column in Table 1.2) for the period of time February 13–February 29 (the
number of observations n = 17) and the assumption that V j = W j + Q j . The optimal
Table 6.1 Calculated optimal values of SIR model parameters for the COVID-19 epidemic in
mainland China
Number of prediction/
optimal values of
parameters
Prediction 1
n = 25
Period taken for calculations T c :
January 16–February 9, 2020
Prediction 2
n = 17
Period taken for calculations
T c : February 13–29, 2020
N
90,611
138,317.9776
m
65,546.5
91,771.3993770612
a
1.477985357571669e-05
4.27635873268949e-06
t
Ã
1
−7.720998173432072
−32.2443982214093
q
0.9688
0.3924
1=q
1.0322
2.5481
r
0.997966487046645
0.994531292187372
S 1 , Eq. (4.9)
45,579
57,061
V 1 , Eq. (4.16)
45,032
81,257
t final , Eq. (4.17)
40
119
Final day of the first wave
February 25, 2020
May 14, 2020
V f , taken from [1]
78,191
84,469
e, Eq. (4.20)
42.4%
3.8%
38
6 SIR Simulations for the First Waves of the COVID-19 …