

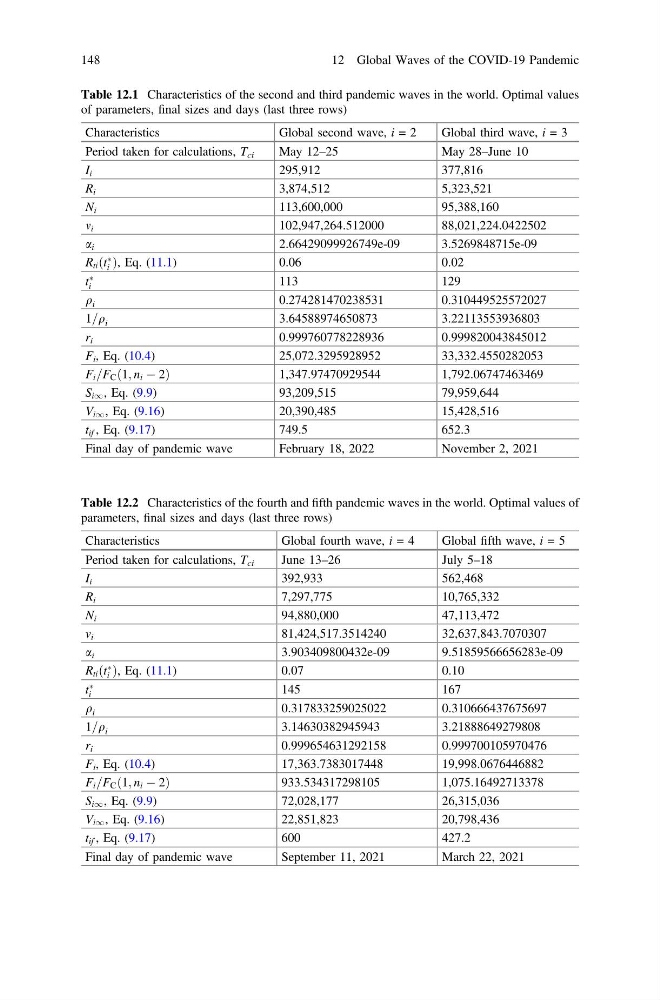
Table 12.1 Characteristics of the second and third pandemic waves in the world. Optimal values
of parameters, final sizes and days (last three rows)
Characteristics
Global second wave, i = 2
Global third wave, i = 3
Period taken for calculations, T ci
May 12–25
May 28–June 10
I i
295,912
377,816
R i
3,874,512
5,323,521
N i
113,600,000
95,388,160
m i
102,947,264.512000
88,021,224.0422502
a i
2.66429099926749e-09
3.5269848715e-09
R ti ðt
Ã
i Þ, Eq. (11.1)
0.06
0.02
t
Ã
i
113
129
q i
0.274281470238531
0.310449525572027
1=q i
3.64588974650873
3.22113553936803
r i
0.999760778228936
0.999820043845012
F i , Eq. (10.4)
25,072.3295928952
33,332.4550282053
F i =F C ð1; n i À 2Þ
1,347.97470929544
1,792.06747463469
S i1 , Eq. (9.9)
93,209,515
79,959,644
V i1 , Eq. (9.16)
20,390,485
15,428,516
t if , Eq. (9.17)
749.5
652.3
Final day of pandemic wave
February 18, 2022
November 2, 2021
Table 12.2 Characteristics of the fourth and fifth pandemic waves in the world. Optimal values of
parameters, final sizes and days (last three rows)
Characteristics
Global fourth wave, i = 4
Global fifth wave, i = 5
Period taken for calculations, T ci
June 13–26
July 5–18
I i
392,933
562,468
R i
7,297,775
10,765,332
N i
94,880,000
47,113,472
v i
81,424,517.3514240
32,637,843.7070307
a i
3.903409800432e-09
9.51859566656283e-09
R ti ðt
Ã
i Þ, Eq. (11.1)
0.07
0.10
t
Ã
i
145
167
q i
0.317833259025022
0.310666437675697
1=q i
3.14630382945943
3.21888649279808
r i
0.999654631292158
0.999700105970476
F i , Eq. (10.4)
17,363.7383017448
19,998.0676446882
F i =F C ð1; n i À 2Þ
933.534317298105
1,075.16492713378
S i1 , Eq. (9.9)
72,028,177
26,315,036
V i1 , Eq. (9.16)
22,851,823
20,798,436
t if , Eq. (9.17)
600
427.2
Final day of pandemic wave
September 11, 2021
March 22, 2021
148
12 Global Waves of the COVID-19 Pandemic
of parameters, final sizes and days (last three rows)
Characteristics
Global second wave, i = 2
Global third wave, i = 3
Period taken for calculations, T ci
May 12–25
May 28–June 10
I i
295,912
377,816
R i
3,874,512
5,323,521
N i
113,600,000
95,388,160
m i
102,947,264.512000
88,021,224.0422502
a i
2.66429099926749e-09
3.5269848715e-09
R ti ðt
Ã
i Þ, Eq. (11.1)
0.06
0.02
t
Ã
i
113
129
q i
0.274281470238531
0.310449525572027
1=q i
3.64588974650873
3.22113553936803
r i
0.999760778228936
0.999820043845012
F i , Eq. (10.4)
25,072.3295928952
33,332.4550282053
F i =F C ð1; n i À 2Þ
1,347.97470929544
1,792.06747463469
S i1 , Eq. (9.9)
93,209,515
79,959,644
V i1 , Eq. (9.16)
20,390,485
15,428,516
t if , Eq. (9.17)
749.5
652.3
Final day of pandemic wave
February 18, 2022
November 2, 2021
Table 12.2 Characteristics of the fourth and fifth pandemic waves in the world. Optimal values of
parameters, final sizes and days (last three rows)
Characteristics
Global fourth wave, i = 4
Global fifth wave, i = 5
Period taken for calculations, T ci
June 13–26
July 5–18
I i
392,933
562,468
R i
7,297,775
10,765,332
N i
94,880,000
47,113,472
v i
81,424,517.3514240
32,637,843.7070307
a i
3.903409800432e-09
9.51859566656283e-09
R ti ðt
Ã
i Þ, Eq. (11.1)
0.07
0.10
t
Ã
i
145
167
q i
0.317833259025022
0.310666437675697
1=q i
3.14630382945943
3.21888649279808
r i
0.999654631292158
0.999700105970476
F i , Eq. (10.4)
17,363.7383017448
19,998.0676446882
F i =F C ð1; n i À 2Þ
933.534317298105
1,075.16492713378
S i1 , Eq. (9.9)
72,028,177
26,315,036
V i1 , Eq. (9.16)
22,851,823
20,798,436
t if , Eq. (9.17)
600
427.2
Final day of pandemic wave
September 11, 2021
March 22, 2021
148
12 Global Waves of the COVID-19 Pandemic