

Table 11.2 Characteristics of fifth and sixth epidemic waves in Ukraine. Optimal values of
parameters, final sizes and days (last three rows)
Characteristics
Ukraine, fifth wave, i = 5
Ukraine, sixth wave, i = 6
Period taken for calculations, T ci
July 20–August 2
August 9–22
I i
4,570
7,525
R i
55,596
73,424
N i
208,624.896
336,210.688000000
m i
117,860.44860629
166,678.304458998
a i
1.241234878e-06
6.47063569e-07
R ti ðt
Ã
i Þ, Eq. (11.1)
0.26
0.53
t
Ã
i
182
201
q i
0.1462924996005
0.107851458558717
1=q i
6.83562043666339
9.27201183334553
r i
0.9997539353297
0.999591012582638
F i , Eq. (10.4)
24,374.834072843
14,661.3785892930
F i =F C ð1; n i À 2Þ
1,310.47495015287
788.246160714677
S i1 , Eq. (9.9)
79,668
91,157
V i1 , Eq. (9.16)
128,957
245,054
t if , Eq. (9.17)
381
443.5
Final day of i-th epidemic wave
February 5, 2021
April 8, 2021
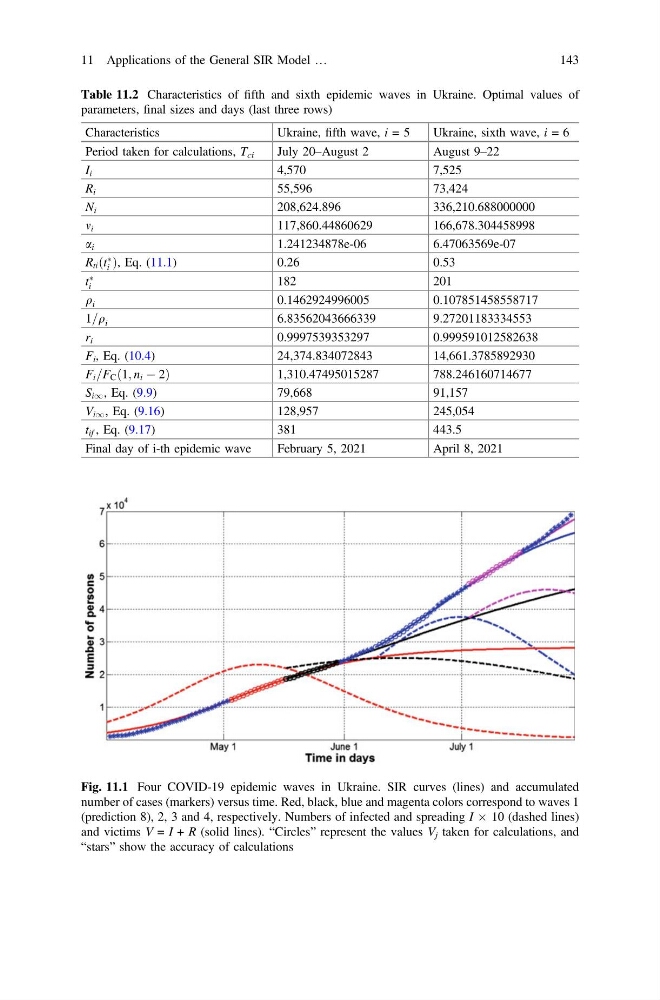
Fig. 11.1 Four COVID-19 epidemic waves in Ukraine. SIR curves (lines) and accumulated
number of cases (markers) versus time. Red, black, blue and magenta colors correspond to waves 1
(prediction 8), 2, 3 and 4, respectively. Numbers of infected and spreading I Â 10 (dashed lines)
and victims V = I + R (solid lines). “Circles” represent the values V j taken for calculations, and
“stars” show the accuracy of calculations
11 Applications of the General SIR Model …
143
parameters, final sizes and days (last three rows)
Characteristics
Ukraine, fifth wave, i = 5
Ukraine, sixth wave, i = 6
Period taken for calculations, T ci
July 20–August 2
August 9–22
I i
4,570
7,525
R i
55,596
73,424
N i
208,624.896
336,210.688000000
m i
117,860.44860629
166,678.304458998
a i
1.241234878e-06
6.47063569e-07
R ti ðt
Ã
i Þ, Eq. (11.1)
0.26
0.53
t
Ã
i
182
201
q i
0.1462924996005
0.107851458558717
1=q i
6.83562043666339
9.27201183334553
r i
0.9997539353297
0.999591012582638
F i , Eq. (10.4)
24,374.834072843
14,661.3785892930
F i =F C ð1; n i À 2Þ
1,310.47495015287
788.246160714677
S i1 , Eq. (9.9)
79,668
91,157
V i1 , Eq. (9.16)
128,957
245,054
t if , Eq. (9.17)
381
443.5
Final day of i-th epidemic wave
February 5, 2021
April 8, 2021
Fig. 11.1 Four COVID-19 epidemic waves in Ukraine. SIR curves (lines) and accumulated
number of cases (markers) versus time. Red, black, blue and magenta colors correspond to waves 1
(prediction 8), 2, 3 and 4, respectively. Numbers of infected and spreading I Â 10 (dashed lines)
and victims V = I + R (solid lines). “Circles” represent the values V j taken for calculations, and
“stars” show the accuracy of calculations
11 Applications of the General SIR Model …
143