

Figure 11.1 illustrates first four waves of the COVID-19 epidemic in Ukraine
shown by different colors (red, black, blue and magenta for waves 1 (prediction 8),
2, 3 and 4, respectively). SIR curves represent the numbers of infected and
spreading I Â 10 (dashed lines) and the number of victims V = I + R (solid lines).
“Circles” in corresponding colors represent the values V j taken for calculations, and
“stars” show the accumulated number of cases used only for the verification of
calculations. Every new wave increased the estimation of the final size V i1 of the
epidemic in Ukraine (see also Tables 11.1 and 11.2).
Every new wave also increases the number of infected and spreading the
infection persons I (represented by dashed lines). The accuracy of simulations is
rather good, especially for second and further pandemic waves, since blue “stars”
(showing the accumulated values of confirmed cases used only for verification of
the calculations) are located very close to the corresponding solid lines showing the
calculated V = I + R values. There are some discrepancies for the early stages of
the first wave, when the number of registered cases is lower than the real one due to
the problems with the identification of the infected persons. It can be seen also in
the beginning of the fifth wave in Ukraine. After July 23, the real number of cases is
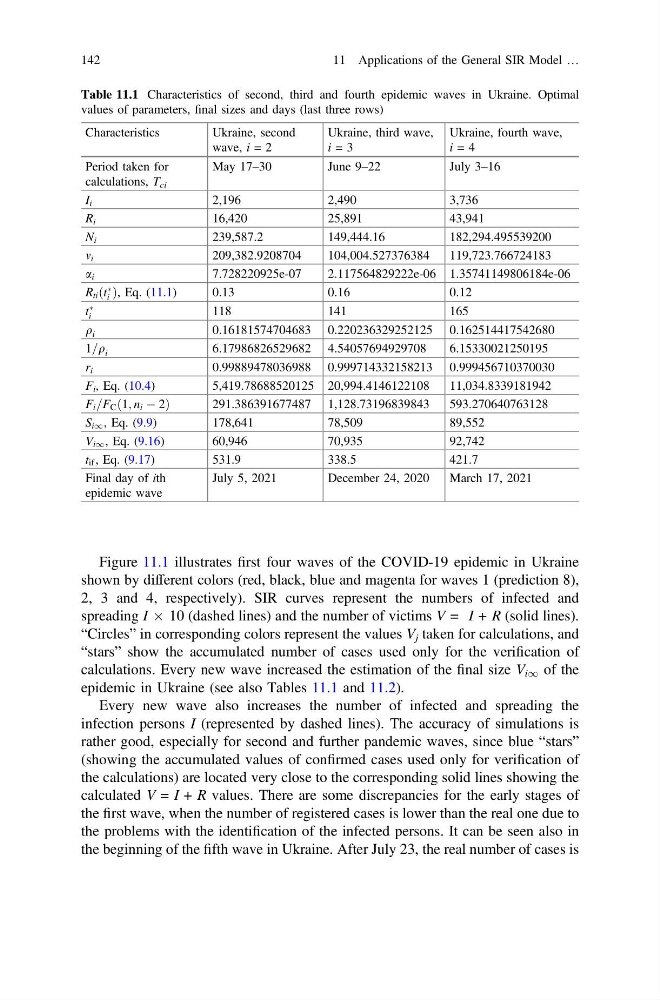
Table 11.1 Characteristics of second, third and fourth epidemic waves in Ukraine. Optimal
values of parameters, final sizes and days (last three rows)
Characteristics
Ukraine, second
wave, i = 2
Ukraine, third wave,
i = 3
Ukraine, fourth wave,
i = 4
Period taken for
calculations, T ci
May 17–30
June 9–22
July 3–16
I i
2,196
2,490
3,736
R i
16,420
25,891
43,941
N i
239,587.2
149,444.16
182,294.495539200
m i
209,382.9208704
104,004.527376384
119,723.766724183
a i
7.728220925e-07
2.117564829222e-06 1.35741149806184e-06
R ti ðt
Ã
i Þ, Eq. (11.1)
0.13
0.16
0.12
t
Ã
i
118
141
165
q i
0.16181574704683 0.220236329252125 0.162514417542680
1=q i
6.17986826529682 4.54057694929708
6.15330021250195
r i
0.99889478036988 0.999714332158213 0.999456710370030
F i , Eq. (10.4)
5,419.78688520125 20,994.4146122108
11,034.8339181942
F i =F C ð1; n i À 2Þ
291.386391677487 1,128.73196839843
593.270640763128
S i1 , Eq. (9.9)
178,641
78,509
89,552
V i1 , Eq. (9.16)
60,946
70,935
92,742
t if , Eq. (9.17)
531.9
338.5
421.7
Final day of ith
epidemic wave
July 5, 2021
December 24, 2020
March 17, 2021
142
11 Applications of the General SIR Model …
shown by different colors (red, black, blue and magenta for waves 1 (prediction 8),
2, 3 and 4, respectively). SIR curves represent the numbers of infected and
spreading I Â 10 (dashed lines) and the number of victims V = I + R (solid lines).
“Circles” in corresponding colors represent the values V j taken for calculations, and
“stars” show the accumulated number of cases used only for the verification of
calculations. Every new wave increased the estimation of the final size V i1 of the
epidemic in Ukraine (see also Tables 11.1 and 11.2).
Every new wave also increases the number of infected and spreading the
infection persons I (represented by dashed lines). The accuracy of simulations is
rather good, especially for second and further pandemic waves, since blue “stars”
(showing the accumulated values of confirmed cases used only for verification of
the calculations) are located very close to the corresponding solid lines showing the
calculated V = I + R values. There are some discrepancies for the early stages of
the first wave, when the number of registered cases is lower than the real one due to
the problems with the identification of the infected persons. It can be seen also in
the beginning of the fifth wave in Ukraine. After July 23, the real number of cases is
Table 11.1 Characteristics of second, third and fourth epidemic waves in Ukraine. Optimal
values of parameters, final sizes and days (last three rows)
Characteristics
Ukraine, second
wave, i = 2
Ukraine, third wave,
i = 3
Ukraine, fourth wave,
i = 4
Period taken for
calculations, T ci
May 17–30
June 9–22
July 3–16
I i
2,196
2,490
3,736
R i
16,420
25,891
43,941
N i
239,587.2
149,444.16
182,294.495539200
m i
209,382.9208704
104,004.527376384
119,723.766724183
a i
7.728220925e-07
2.117564829222e-06 1.35741149806184e-06
R ti ðt
Ã
i Þ, Eq. (11.1)
0.13
0.16
0.12
t
Ã
i
118
141
165
q i
0.16181574704683 0.220236329252125 0.162514417542680
1=q i
6.17986826529682 4.54057694929708
6.15330021250195
r i
0.99889478036988 0.999714332158213 0.999456710370030
F i , Eq. (10.4)
5,419.78688520125 20,994.4146122108
11,034.8339181942
F i =F C ð1; n i À 2Þ
291.386391677487 1,128.73196839843
593.270640763128
S i1 , Eq. (9.9)
178,641
78,509
89,552
V i1 , Eq. (9.16)
60,946
70,935
92,742
t if , Eq. (9.17)
531.9
338.5
421.7
Final day of ith
epidemic wave
July 5, 2021
December 24, 2020
March 17, 2021
142
11 Applications of the General SIR Model …