

higher than the calculated one for the fourth wave (compare blue “stars” and solid
magenta line in Fig. 11.1).
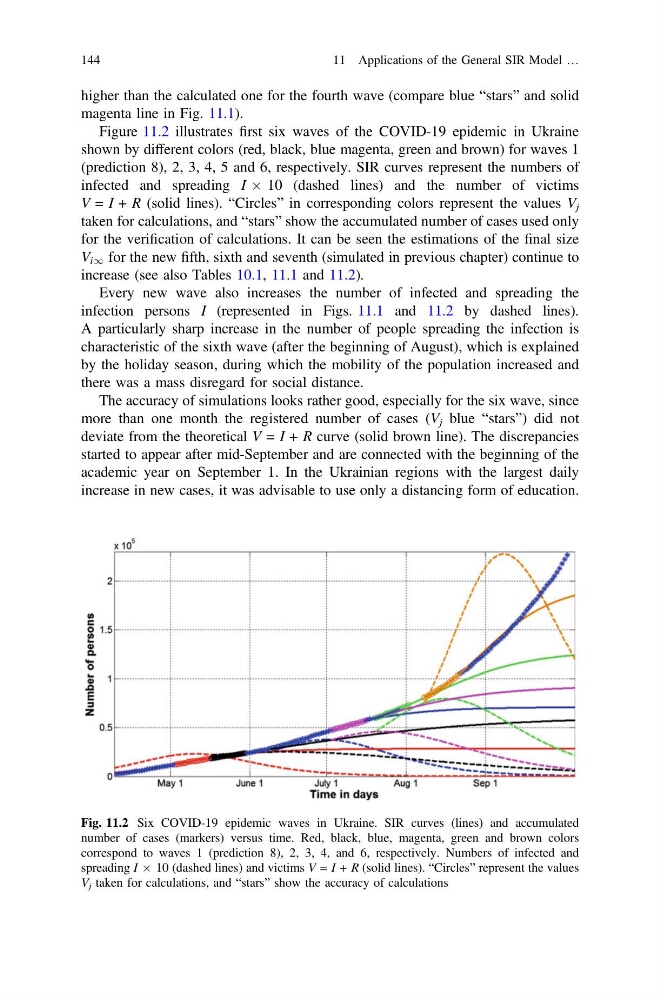
Figure 11.2 illustrates first six waves of the COVID-19 epidemic in Ukraine
shown by different colors (red, black, blue magenta, green and brown) for waves 1
(prediction 8), 2, 3, 4, 5 and 6, respectively. SIR curves represent the numbers of
infected and spreading I Â 10 (dashed lines) and the number of victims
V = I + R (solid lines). “Circles” in corresponding colors represent the values V j
taken for calculations, and “stars” show the accumulated number of cases used only
for the verification of calculations. It can be seen the estimations of the final size
V i1 for the new fifth, sixth and seventh (simulated in previous chapter) continue to
increase (see also Tables 10.1, 11.1 and 11.2).
Every new wave also increases the number of infected and spreading the
infection persons I (represented in Figs. 11.1 and 11.2 by dashed lines).
A particularly sharp increase in the number of people spreading the infection is
characteristic of the sixth wave (after the beginning of August), which is explained
by the holiday season, during which the mobility of the population increased and
there was a mass disregard for social distance.
The accuracy of simulations looks rather good, especially for the six wave, since
more than one month the registered number of cases (V j blue “stars”) did not
deviate from the theoretical V = I + R curve (solid brown line). The discrepancies
started to appear after mid-September and are connected with the beginning of the
academic year on September 1. In the Ukrainian regions with the largest daily
increase in new cases, it was advisable to use only a distancing form of education.
Fig. 11.2 Six COVID-19 epidemic waves in Ukraine. SIR curves (lines) and accumulated
number of cases (markers) versus time. Red, black, blue, magenta, green and brown colors
correspond to waves 1 (prediction 8), 2, 3, 4, and 6, respectively. Numbers of infected and
spreading I Â 10 (dashed lines) and victims V = I + R (solid lines). “Circles” represent the values
V j taken for calculations, and “stars” show the accuracy of calculations
144
11 Applications of the General SIR Model …
magenta line in Fig. 11.1).
Figure 11.2 illustrates first six waves of the COVID-19 epidemic in Ukraine
shown by different colors (red, black, blue magenta, green and brown) for waves 1
(prediction 8), 2, 3, 4, 5 and 6, respectively. SIR curves represent the numbers of
infected and spreading I Â 10 (dashed lines) and the number of victims
V = I + R (solid lines). “Circles” in corresponding colors represent the values V j
taken for calculations, and “stars” show the accumulated number of cases used only
for the verification of calculations. It can be seen the estimations of the final size
V i1 for the new fifth, sixth and seventh (simulated in previous chapter) continue to
increase (see also Tables 10.1, 11.1 and 11.2).
Every new wave also increases the number of infected and spreading the
infection persons I (represented in Figs. 11.1 and 11.2 by dashed lines).
A particularly sharp increase in the number of people spreading the infection is
characteristic of the sixth wave (after the beginning of August), which is explained
by the holiday season, during which the mobility of the population increased and
there was a mass disregard for social distance.
The accuracy of simulations looks rather good, especially for the six wave, since
more than one month the registered number of cases (V j blue “stars”) did not
deviate from the theoretical V = I + R curve (solid brown line). The discrepancies
started to appear after mid-September and are connected with the beginning of the
academic year on September 1. In the Ukrainian regions with the largest daily
increase in new cases, it was advisable to use only a distancing form of education.
Fig. 11.2 Six COVID-19 epidemic waves in Ukraine. SIR curves (lines) and accumulated
number of cases (markers) versus time. Red, black, blue, magenta, green and brown colors
correspond to waves 1 (prediction 8), 2, 3, 4, and 6, respectively. Numbers of infected and
spreading I Â 10 (dashed lines) and victims V = I + R (solid lines). “Circles” represent the values
V j taken for calculations, and “stars” show the accuracy of calculations
144
11 Applications of the General SIR Model …