

The convergence was rather good (after 10 iterations, the values e
ðkÞ
a were less than
10
À4 for some ranges of independent parameters N i and m i ). The calculations were
performed with the use of original MATLAB code. Knowing the optimal values of
the parameters N i ; m i ; I i ; R i , anyone familiar with the differential equations can
obtain SIR curves and predictions with the use of formulas available in the previous
chapter.
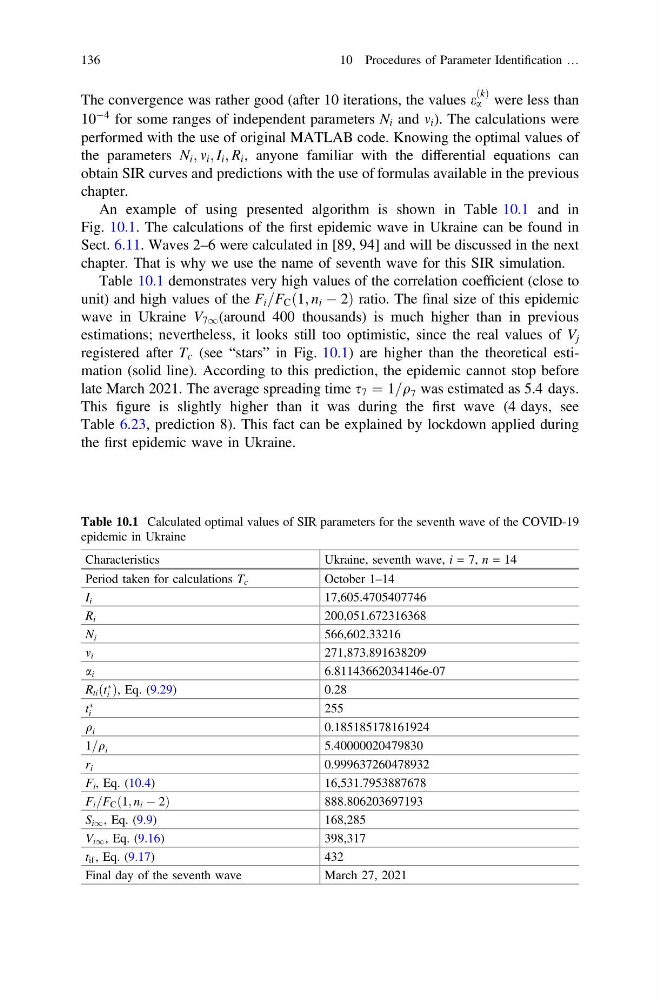
An example of using presented algorithm is shown in Table 10.1 and in
Fig. 10.1. The calculations of the first epidemic wave in Ukraine can be found in
Sect. 6.11. Waves 2–6 were calculated in [89, 94] and will be discussed in the next
chapter. That is why we use the name of seventh wave for this SIR simulation.
Table 10.1 demonstrates very high values of the correlation coefficient (close to
unit) and high values of the F i =F C ð1; n i À 2Þ ratio. The final size of this epidemic
wave in Ukraine V 71 (around 400 thousands) is much higher than in previous
estimations; nevertheless, it looks still too optimistic, since the real values of V j
registered after T c (see “stars” in Fig. 10.1) are higher than the theoretical estimation (solid line). According to this prediction, the epidemic cannot stop before
late March 2021. The average spreading time s 7 ¼ 1=q 7 was estimated as 5.4 days.
This figure is slightly higher than it was during the first wave (4 days, see
Table 6.23, prediction 8). This fact can be explained by lockdown applied during
the first epidemic wave in Ukraine.
Table 10.1 Calculated optimal values of SIR parameters for the seventh wave of the COVID-19
epidemic in Ukraine
Characteristics
Ukraine, seventh wave, i = 7, n = 14
Period taken for calculations T c
October 1–14
I i
17,605.4705407746
R i
200,051.672316368
N i
566,602.33216
m i
271,873.891638209
a i
6.81143662034146e-07
R ti ðt
Ã
i Þ, Eq. (9.29)
0.28
t
Ã
i
255
q i
0.185185178161924
1=q i
5.40000020479830
r i
0.999637260478932
F i , Eq. (10.4)
16,531.7953887678
F i =F C ð1; n i À 2Þ
888.806203697193
S i1 , Eq. (9.9)
168,285
V i1 , Eq. (9.16)
398,317
t if , Eq. (9.17)
432
Final day of the seventh wave
March 27, 2021
136
10 Procedures of Parameter Identification …
ðkÞ
a were less than
10
À4 for some ranges of independent parameters N i and m i ). The calculations were
performed with the use of original MATLAB code. Knowing the optimal values of
the parameters N i ; m i ; I i ; R i , anyone familiar with the differential equations can
obtain SIR curves and predictions with the use of formulas available in the previous
chapter.
An example of using presented algorithm is shown in Table 10.1 and in
Fig. 10.1. The calculations of the first epidemic wave in Ukraine can be found in
Sect. 6.11. Waves 2–6 were calculated in [89, 94] and will be discussed in the next
chapter. That is why we use the name of seventh wave for this SIR simulation.
Table 10.1 demonstrates very high values of the correlation coefficient (close to
unit) and high values of the F i =F C ð1; n i À 2Þ ratio. The final size of this epidemic
wave in Ukraine V 71 (around 400 thousands) is much higher than in previous
estimations; nevertheless, it looks still too optimistic, since the real values of V j
registered after T c (see “stars” in Fig. 10.1) are higher than the theoretical estimation (solid line). According to this prediction, the epidemic cannot stop before
late March 2021. The average spreading time s 7 ¼ 1=q 7 was estimated as 5.4 days.
This figure is slightly higher than it was during the first wave (4 days, see
Table 6.23, prediction 8). This fact can be explained by lockdown applied during
the first epidemic wave in Ukraine.
Table 10.1 Calculated optimal values of SIR parameters for the seventh wave of the COVID-19
epidemic in Ukraine
Characteristics
Ukraine, seventh wave, i = 7, n = 14
Period taken for calculations T c
October 1–14
I i
17,605.4705407746
R i
200,051.672316368
N i
566,602.33216
m i
271,873.891638209
a i
6.81143662034146e-07
R ti ðt
Ã
i Þ, Eq. (9.29)
0.28
t
Ã
i
255
q i
0.185185178161924
1=q i
5.40000020479830
r i
0.999637260478932
F i , Eq. (10.4)
16,531.7953887678
F i =F C ð1; n i À 2Þ
888.806203697193
S i1 , Eq. (9.9)
168,285
V i1 , Eq. (9.16)
398,317
t if , Eq. (9.17)
432
Final day of the seventh wave
March 27, 2021
136
10 Procedures of Parameter Identification …