

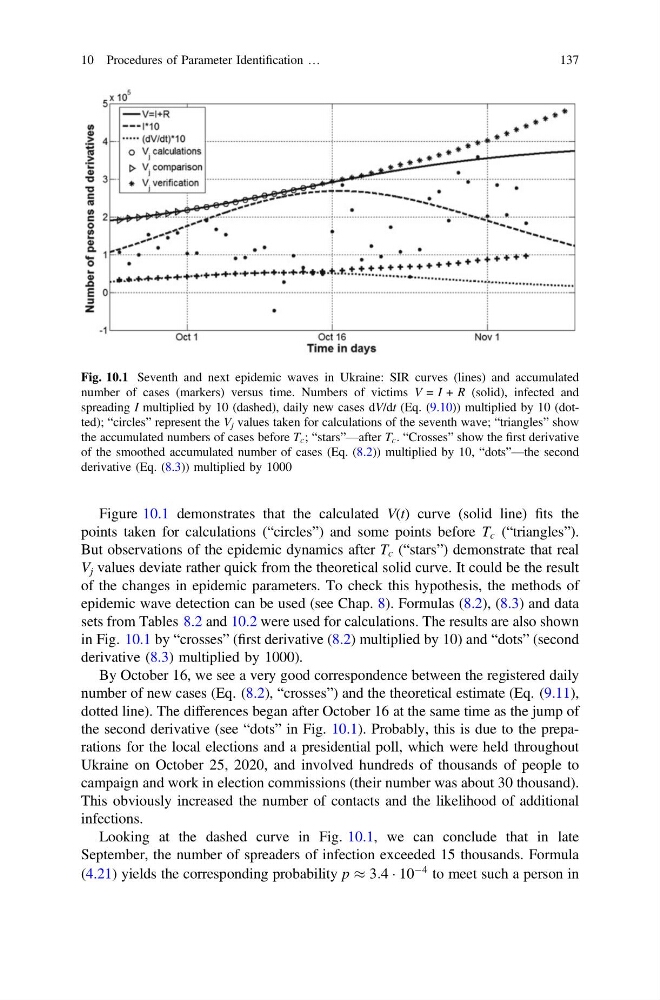
Figure 10.1 demonstrates that the calculated V(t) curve (solid line) fits the
points taken for calculations (“circles”) and some points before T c (“triangles”).
But observations of the epidemic dynamics after T c (“stars”) demonstrate that real
V j values deviate rather quick from the theoretical solid curve. It could be the result
of the changes in epidemic parameters. To check this hypothesis, the methods of
epidemic wave detection can be used (see Chap. 8). Formulas (8.2), (8.3) and data
sets from Tables 8.2 and 10.2 were used for calculations. The results are also shown
in Fig. 10.1 by “crosses” (first derivative (8.2) multiplied by 10) and “dots” (second
derivative (8.3) multiplied by 1000).
By October 16, we see a very good correspondence between the registered daily
number of new cases (Eq. (8.2), “crosses”) and the theoretical estimate (Eq. (9.11),
dotted line). The differences began after October 16 at the same time as the jump of
the second derivative (see “dots” in Fig. 10.1). Probably, this is due to the preparations for the local elections and a presidential poll, which were held throughout
Ukraine on October 25, 2020, and involved hundreds of thousands of people to
campaign and work in election commissions (their number was about 30 thousand).
This obviously increased the number of contacts and the likelihood of additional
infections.
Looking at the dashed curve in Fig. 10.1, we can conclude that in late
September, the number of spreaders of infection exceeded 15 thousands. Formula
(4.21) yields the corresponding probability p % 3:4 Á 10
À4 to meet such a person in
Fig. 10.1 Seventh and next epidemic waves in Ukraine: SIR curves (lines) and accumulated
number of cases (markers) versus time. Numbers of victims V = I + R (solid), infected and
spreading I multiplied by 10 (dashed), daily new cases dV/dt (Eq. (9.10)) multiplied by 10 (dotted); “circles” represent the V j values taken for calculations of the seventh wave; “triangles” show
the accumulated numbers of cases before T c ; “stars”—after T c . “Crosses” show the first derivative
of the smoothed accumulated number of cases (Eq. (8.2)) multiplied by 10, “dots”—the second
derivative (Eq. (8.3)) multiplied by 1000
10 Procedures of Parameter Identification …
137
points taken for calculations (“circles”) and some points before T c (“triangles”).
But observations of the epidemic dynamics after T c (“stars”) demonstrate that real
V j values deviate rather quick from the theoretical solid curve. It could be the result
of the changes in epidemic parameters. To check this hypothesis, the methods of
epidemic wave detection can be used (see Chap. 8). Formulas (8.2), (8.3) and data
sets from Tables 8.2 and 10.2 were used for calculations. The results are also shown
in Fig. 10.1 by “crosses” (first derivative (8.2) multiplied by 10) and “dots” (second
derivative (8.3) multiplied by 1000).
By October 16, we see a very good correspondence between the registered daily
number of new cases (Eq. (8.2), “crosses”) and the theoretical estimate (Eq. (9.11),
dotted line). The differences began after October 16 at the same time as the jump of
the second derivative (see “dots” in Fig. 10.1). Probably, this is due to the preparations for the local elections and a presidential poll, which were held throughout
Ukraine on October 25, 2020, and involved hundreds of thousands of people to
campaign and work in election commissions (their number was about 30 thousand).
This obviously increased the number of contacts and the likelihood of additional
infections.
Looking at the dashed curve in Fig. 10.1, we can conclude that in late
September, the number of spreaders of infection exceeded 15 thousands. Formula
(4.21) yields the corresponding probability p % 3:4 Á 10
À4 to meet such a person in
Fig. 10.1 Seventh and next epidemic waves in Ukraine: SIR curves (lines) and accumulated
number of cases (markers) versus time. Numbers of victims V = I + R (solid), infected and
spreading I multiplied by 10 (dashed), daily new cases dV/dt (Eq. (9.10)) multiplied by 10 (dotted); “circles” represent the V j values taken for calculations of the seventh wave; “triangles” show
the accumulated numbers of cases before T c ; “stars”—after T c . “Crosses” show the first derivative
of the smoothed accumulated number of cases (Eq. (8.2)) multiplied by 10, “dots”—the second
derivative (Eq. (8.3)) multiplied by 1000
10 Procedures of Parameter Identification …
137