

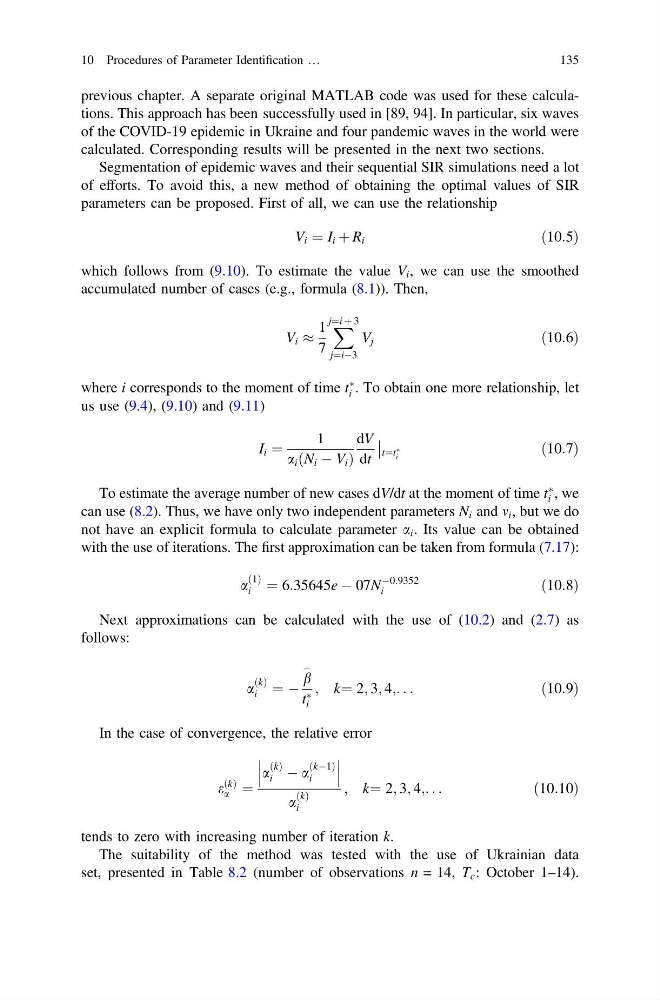
previous chapter. A separate original MATLAB code was used for these calculations. This approach has been successfully used in [89, 94]. In particular, six waves
of the COVID-19 epidemic in Ukraine and four pandemic waves in the world were
calculated. Corresponding results will be presented in the next two sections.
Segmentation of epidemic waves and their sequential SIR simulations need a lot
of efforts. To avoid this, a new method of obtaining the optimal values of SIR
parameters can be proposed. First of all, we can use the relationship
V i ¼ I i þ R i
ð10:5Þ
which follows from (9.10). To estimate the value V i , we can use the smoothed
accumulated number of cases (e.g., formula (8.1)). Then,
V i %
1
7
X
j¼i þ 3
j¼iÀ3
V j
ð10:6Þ
where i corresponds to the moment of time t
Ã
i . To obtain one more relationship, let
us use (9.4), (9.10) and (9.11)
I i ¼
1
a i ðN i À V i Þ
dV
dt
t¼t Ã
i
ð10:7Þ
To estimate the average number of new cases dV/dt at the moment of time t
Ã
i , we
can use (8.2). Thus, we have only two independent parameters N i and m i , but we do
not have an explicit formula to calculate parameter a i . Its value can be obtained
with the use of iterations. The first approximation can be taken from formula (7.17):
a
ð1Þ
i ¼ 6:35645e À 07N
À0:9352
i
ð10:8Þ
Next approximations can be calculated with the use of (10.2) and (2.7) as
follows:
a
ðkÞ
i ¼ À
b
_
t Ã
i
; k¼ 2; 3; 4;. . .
ð10:9Þ
In the case of convergence, the relative error
e
ðkÞ
a ¼
a
ðkÞ
i À a
ðkÀ1Þ
i
a
ðkÞ
i
; k¼ 2; 3; 4;. . .
ð10:10Þ
tends to zero with increasing number of iteration k.
The suitability of the method was tested with the use of Ukrainian data
set, presented in Table 8.2 (number of observations n = 14, T c : October 1–14).
10 Procedures of Parameter Identification …
135
of the COVID-19 epidemic in Ukraine and four pandemic waves in the world were
calculated. Corresponding results will be presented in the next two sections.
Segmentation of epidemic waves and their sequential SIR simulations need a lot
of efforts. To avoid this, a new method of obtaining the optimal values of SIR
parameters can be proposed. First of all, we can use the relationship
V i ¼ I i þ R i
ð10:5Þ
which follows from (9.10). To estimate the value V i , we can use the smoothed
accumulated number of cases (e.g., formula (8.1)). Then,
V i %
1
7
X
j¼i þ 3
j¼iÀ3
V j
ð10:6Þ
where i corresponds to the moment of time t
Ã
i . To obtain one more relationship, let
us use (9.4), (9.10) and (9.11)
I i ¼
1
a i ðN i À V i Þ
dV
dt
t¼t Ã
i
ð10:7Þ
To estimate the average number of new cases dV/dt at the moment of time t
Ã
i , we
can use (8.2). Thus, we have only two independent parameters N i and m i , but we do
not have an explicit formula to calculate parameter a i . Its value can be obtained
with the use of iterations. The first approximation can be taken from formula (7.17):
a
ð1Þ
i ¼ 6:35645e À 07N
À0:9352
i
ð10:8Þ
Next approximations can be calculated with the use of (10.2) and (2.7) as
follows:
a
ðkÞ
i ¼ À
b
_
t Ã
i
; k¼ 2; 3; 4;. . .
ð10:9Þ
In the case of convergence, the relative error
e
ðkÞ
a ¼
a
ðkÞ
i À a
ðkÀ1Þ
i
a
ðkÞ
i
; k¼ 2; 3; 4;. . .
ð10:10Þ
tends to zero with increasing number of iteration k.
The suitability of the method was tested with the use of Ukrainian data
set, presented in Table 8.2 (number of observations n = 14, T c : October 1–14).
10 Procedures of Parameter Identification …
135