

values of a Á N pop . The relative value of the parameter a calculated for mainland
Chine and the Republic of Korea is much higher in comparison with other countries
and regions (see Table 7.4). This fact needs a special discussion and investigation.
We will consider the peculiarities of the COVID-19 pandemic in these countries
and corresponding WHO region later.
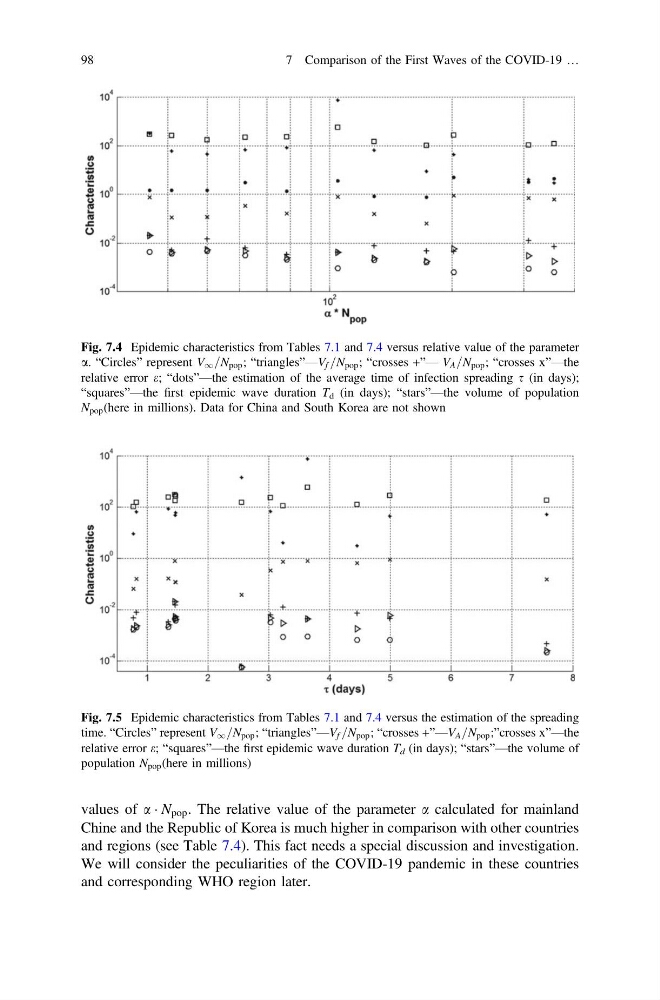
Fig. 7.4 Epidemic characteristics from Tables 7.1 and 7.4 versus relative value of the parameter
a. “Circles” represent V 1 =N pop ; “triangles”—V f =N pop ; “crosses +”— V A =N pop ; “crosses x”—the
relative error e; “dots”—the estimation of the average time of infection spreading s (in days);
“squares”—the first epidemic wave duration T d (in days); “stars”—the volume of population
N pop (here in millions). Data for China and South Korea are not shown
Fig. 7.5 Epidemic characteristics from Tables 7.1 and 7.4 versus the estimation of the spreading
time. “Circles” represent V 1 =N pop ; “triangles”—V f =N pop ; “crosses +”—V A =N pop ;”crosses x”—the
relative error e; “squares”—the first epidemic wave duration T d (in days); “stars”—the volume of
population N pop (here in millions)
98
7 Comparison of the First Waves of the COVID-19 …
Chine and the Republic of Korea is much higher in comparison with other countries
and regions (see Table 7.4). This fact needs a special discussion and investigation.
We will consider the peculiarities of the COVID-19 pandemic in these countries
and corresponding WHO region later.
Fig. 7.4 Epidemic characteristics from Tables 7.1 and 7.4 versus relative value of the parameter
a. “Circles” represent V 1 =N pop ; “triangles”—V f =N pop ; “crosses +”— V A =N pop ; “crosses x”—the
relative error e; “dots”—the estimation of the average time of infection spreading s (in days);
“squares”—the first epidemic wave duration T d (in days); “stars”—the volume of population
N pop (here in millions). Data for China and South Korea are not shown
Fig. 7.5 Epidemic characteristics from Tables 7.1 and 7.4 versus the estimation of the spreading
time. “Circles” represent V 1 =N pop ; “triangles”—V f =N pop ; “crosses +”—V A =N pop ;”crosses x”—the
relative error e; “squares”—the first epidemic wave duration T d (in days); “stars”—the volume of
population N pop (here in millions)
98
7 Comparison of the First Waves of the COVID-19 …