

Figure 7.5 illustrates the values presented in Tables 7.1 and 7.4 versus the
estimation of the spreading time s ¼ 1=q. It can be seen that the smallest values of
V 1 =N pop (“circles”), V f =N pop (“triangles”) and V A =N pop (“crosses +”) correspond to
the cases of China and Korea. This fact again draws special attention to the
dynamics of the pandemic in these countries.
Formulas (7.5) and (7.6) can be used to estimate the final sizes of the first
pandemic waves in different WHO regions. But first, we need to analyze how the
pandemic waves look. We can use the information from the WHO Weekly
Epidemiology Update [93] where the number of new COVID-19 cases confirmed
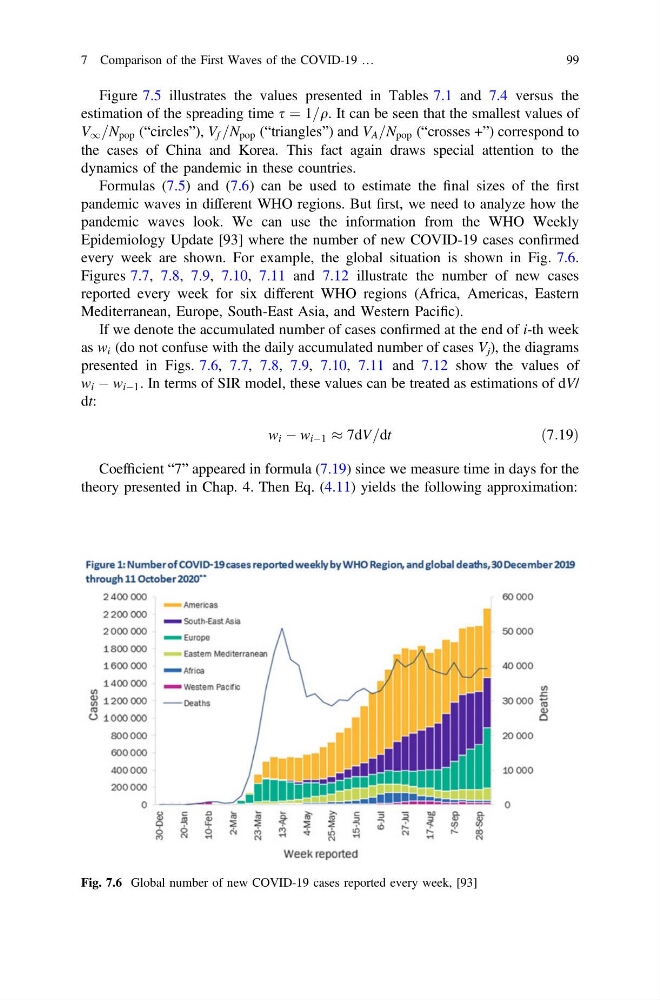
every week are shown. For example, the global situation is shown in Fig. 7.6.
Figures 7.7, 7.8, 7.9, 7.10, 7.11 and 7.12 illustrate the number of new cases
reported every week for six different WHO regions (Africa, Americas, Eastern
Mediterranean, Europe, South-East Asia, and Western Pacific).
If we denote the accumulated number of cases confirmed at the end of i-th week
as w i (do not confuse with the daily accumulated number of cases V j ), the diagrams
presented in Figs. 7.6, 7.7, 7.8, 7.9, 7.10, 7.11 and 7.12 show the values of
w i À w iÀ1 . In terms of SIR model, these values can be treated as estimations of dV/
dt:
w i À w iÀ1 % 7dV=dt
ð7:19Þ
Coefficient “7” appeared in formula (7.19) since we measure time in days for the
theory presented in Chap. 4. Then Eq. (4.11) yields the following approximation:
Fig. 7.6 Global number of new COVID-19 cases reported every week, [93]
7 Comparison of the First Waves of the COVID-19 …
99
estimation of the spreading time s ¼ 1=q. It can be seen that the smallest values of
V 1 =N pop (“circles”), V f =N pop (“triangles”) and V A =N pop (“crosses +”) correspond to
the cases of China and Korea. This fact again draws special attention to the
dynamics of the pandemic in these countries.
Formulas (7.5) and (7.6) can be used to estimate the final sizes of the first
pandemic waves in different WHO regions. But first, we need to analyze how the
pandemic waves look. We can use the information from the WHO Weekly
Epidemiology Update [93] where the number of new COVID-19 cases confirmed
every week are shown. For example, the global situation is shown in Fig. 7.6.
Figures 7.7, 7.8, 7.9, 7.10, 7.11 and 7.12 illustrate the number of new cases
reported every week for six different WHO regions (Africa, Americas, Eastern
Mediterranean, Europe, South-East Asia, and Western Pacific).
If we denote the accumulated number of cases confirmed at the end of i-th week
as w i (do not confuse with the daily accumulated number of cases V j ), the diagrams
presented in Figs. 7.6, 7.7, 7.8, 7.9, 7.10, 7.11 and 7.12 show the values of
w i À w iÀ1 . In terms of SIR model, these values can be treated as estimations of dV/
dt:
w i À w iÀ1 % 7dV=dt
ð7:19Þ
Coefficient “7” appeared in formula (7.19) since we measure time in days for the
theory presented in Chap. 4. Then Eq. (4.11) yields the following approximation:
Fig. 7.6 Global number of new COVID-19 cases reported every week, [93]
7 Comparison of the First Waves of the COVID-19 …
99