

Ukraine looks like an exception, since its final day is October 11, 2020). In addition to
problems with identifying patients, this may also be the result of premature easing of
quarantine and mass non-compliance with social distance.
The highest values of V 1 =N pop were predicted for the USA and Spain, but the
first wave of epidemic in Spain has finished with small enough value of the relative
error e. It means that quarantine and social behavior in this country were effective
enough to stabilize the first wave. We saw a different picture in the USA, which led
to the beginning of the next waves before the end of the first one. This is evidenced
by the high error e and the largest V A =N pop value (among presented in Table 7.4).
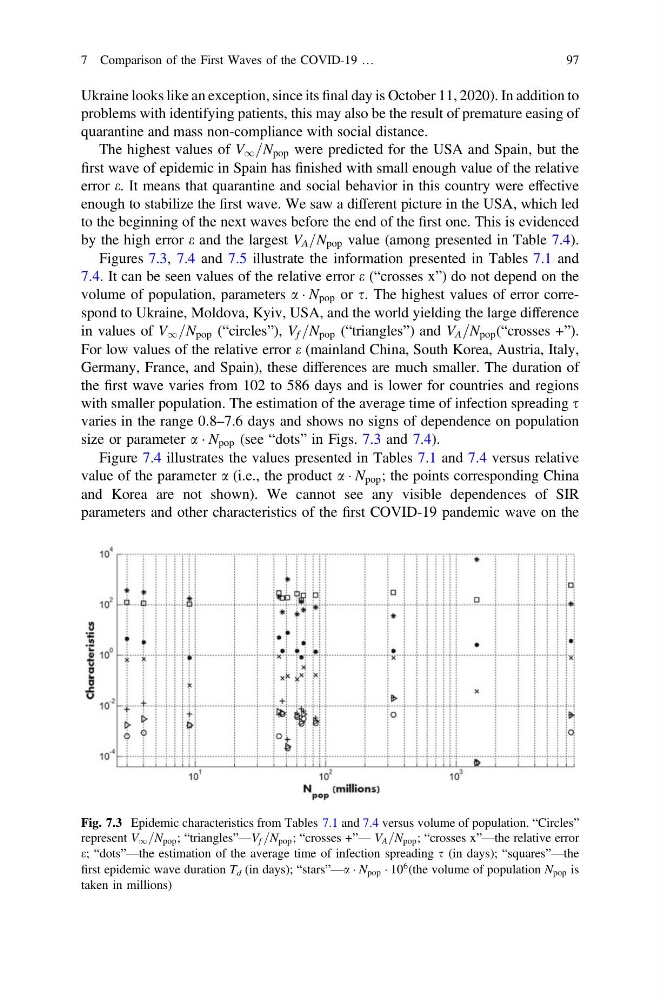
Figures 7.3, 7.4 and 7.5 illustrate the information presented in Tables 7.1 and
7.4. It can be seen values of the relative error e (“crosses x”) do not depend on the
volume of population, parameters a Á N pop or s. The highest values of error correspond to Ukraine, Moldova, Kyiv, USA, and the world yielding the large difference
in values of V 1 =N pop (“circles”), V f =N pop (“triangles”) and V A =N pop (“crosses +”).
For low values of the relative error e (mainland China, South Korea, Austria, Italy,
Germany, France, and Spain), these differences are much smaller. The duration of
the first wave varies from 102 to 586 days and is lower for countries and regions
with smaller population. The estimation of the average time of infection spreading s
varies in the range 0.8–7.6 days and shows no signs of dependence on population
size or parameter a Á N pop (see “dots” in Figs. 7.3 and 7.4).
Figure 7.4 illustrates the values presented in Tables 7.1 and 7.4 versus relative
value of the parameter a (i.e., the product a Á N pop ; the points corresponding China
and Korea are not shown). We cannot see any visible dependences of SIR
parameters and other characteristics of the first COVID-19 pandemic wave on the
Fig. 7.3 Epidemic characteristics from Tables 7.1 and 7.4 versus volume of population. “Circles”
represent V 1 =N pop ; “triangles”—V f =N pop ; “crosses +”— V A =N pop ; “crosses x”—the relative error
e; “dots”—the estimation of the average time of infection spreading s (in days); “squares”—the
first epidemic wave duration T d (in days); “stars”—a Á N pop Á 10
6 (the volume of population N pop is
taken in millions)
7 Comparison of the First Waves of the COVID-19 …
97
problems with identifying patients, this may also be the result of premature easing of
quarantine and mass non-compliance with social distance.
The highest values of V 1 =N pop were predicted for the USA and Spain, but the
first wave of epidemic in Spain has finished with small enough value of the relative
error e. It means that quarantine and social behavior in this country were effective
enough to stabilize the first wave. We saw a different picture in the USA, which led
to the beginning of the next waves before the end of the first one. This is evidenced
by the high error e and the largest V A =N pop value (among presented in Table 7.4).
Figures 7.3, 7.4 and 7.5 illustrate the information presented in Tables 7.1 and
7.4. It can be seen values of the relative error e (“crosses x”) do not depend on the
volume of population, parameters a Á N pop or s. The highest values of error correspond to Ukraine, Moldova, Kyiv, USA, and the world yielding the large difference
in values of V 1 =N pop (“circles”), V f =N pop (“triangles”) and V A =N pop (“crosses +”).
For low values of the relative error e (mainland China, South Korea, Austria, Italy,
Germany, France, and Spain), these differences are much smaller. The duration of
the first wave varies from 102 to 586 days and is lower for countries and regions
with smaller population. The estimation of the average time of infection spreading s
varies in the range 0.8–7.6 days and shows no signs of dependence on population
size or parameter a Á N pop (see “dots” in Figs. 7.3 and 7.4).
Figure 7.4 illustrates the values presented in Tables 7.1 and 7.4 versus relative
value of the parameter a (i.e., the product a Á N pop ; the points corresponding China
and Korea are not shown). We cannot see any visible dependences of SIR
parameters and other characteristics of the first COVID-19 pandemic wave on the
Fig. 7.3 Epidemic characteristics from Tables 7.1 and 7.4 versus volume of population. “Circles”
represent V 1 =N pop ; “triangles”—V f =N pop ; “crosses +”— V A =N pop ; “crosses x”—the relative error
e; “dots”—the estimation of the average time of infection spreading s (in days); “squares”—the
first epidemic wave duration T d (in days); “stars”—a Á N pop Á 10
6 (the volume of population N pop is
taken in millions)
7 Comparison of the First Waves of the COVID-19 …
97