

a ¼ 6:35645e - 07N
À0:9352
ð7:17Þ
V 1 ¼ 400:119N
0:8598
ð7:18Þ
In relationships (7.17) and (7.18), the values of SIR parameter N must be taken
in millions. These approximate formulas can be useful to control new SIR simulations due to the high levels of F=F C ratio. But they contain a priori unknown
parameter N (its values can be estimated with the use of the procedure proposed in
Chap. 5). In comparison, formulas (7.3)–(7.6) allow estimating the values of epidemic parameters without any new SIR simulations. The relative characteristics
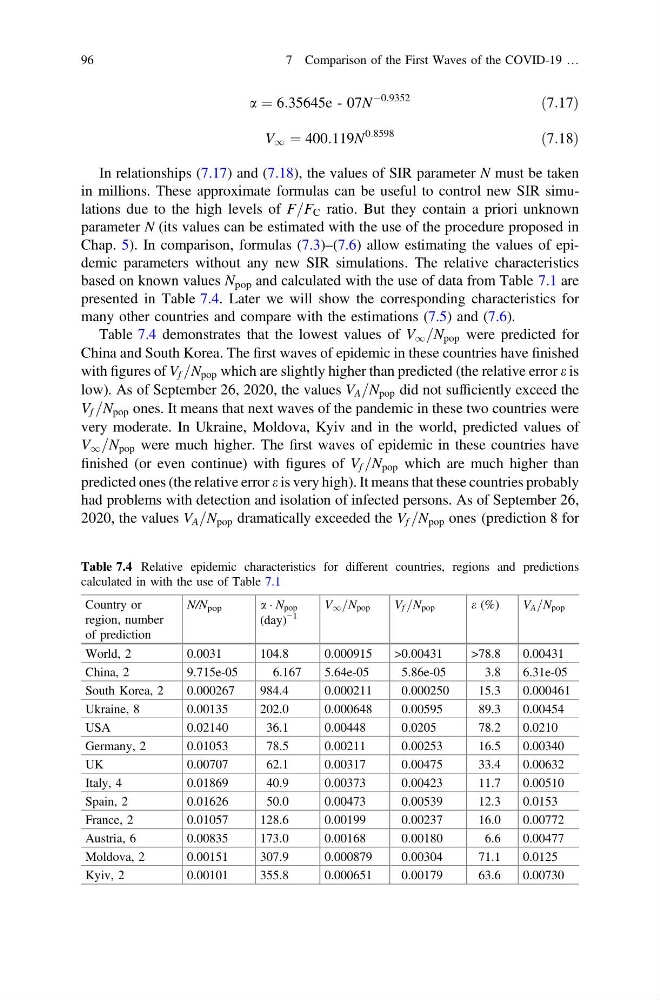
based on known values N pop and calculated with the use of data from Table 7.1 are
presented in Table 7.4. Later we will show the corresponding characteristics for
many other countries and compare with the estimations (7.5) and (7.6).
Table 7.4 demonstrates that the lowest values of V 1 =N pop were predicted for
China and South Korea. The first waves of epidemic in these countries have finished
with figures of V f =N pop which are slightly higher than predicted (the relative error e is
low). As of September 26, 2020, the values V A =N pop did not sufficiently exceed the
V f =N pop ones. It means that next waves of the pandemic in these two countries were
very moderate. In Ukraine, Moldova, Kyiv and in the world, predicted values of
V 1 =N pop were much higher. The first waves of epidemic in these countries have
finished (or even continue) with figures of V f =N pop which are much higher than
predicted ones (the relative error e is very high). It means that these countries probably
had problems with detection and isolation of infected persons. As of September 26,
2020, the values V A =N pop dramatically exceeded the V f =N pop ones (prediction 8 for
Table 7.4 Relative epidemic characteristics for different countries, regions and predictions
calculated in with the use of Table 7.1
Country or
region, number
of prediction
N/N pop
a Á N pop
(day)
−1
V 1 =N pop
V f =N pop
e (%)
V A =N pop
World, 2
0.0031
104.8
0.000915
>0.00431
>78.8
0.00431
China, 2
9.715e-05
6.167
5.64e-05
5.86e-05
3.8
6.31e-05
South Korea, 2
0.000267
984.4
0.000211
0.000250
15.3
0.000461
Ukraine, 8
0.00135
202.0
0.000648
0.00595
89.3
0.00454
USA
0.02140
36.1
0.00448
0.0205
78.2
0.0210
Germany, 2
0.01053
78.5
0.00211
0.00253
16.5
0.00340
UK
0.00707
62.1
0.00317
0.00475
33.4
0.00632
Italy, 4
0.01869
40.9
0.00373
0.00423
11.7
0.00510
Spain, 2
0.01626
50.0
0.00473
0.00539
12.3
0.0153
France, 2
0.01057
128.6
0.00199
0.00237
16.0
0.00772
Austria, 6
0.00835
173.0
0.00168
0.00180
6.6
0.00477
Moldova, 2
0.00151
307.9
0.000879
0.00304
71.1
0.0125
Kyiv, 2
0.00101
355.8
0.000651
0.00179
63.6
0.00730
96
7 Comparison of the First Waves of the COVID-19 …
À0:9352
ð7:17Þ
V 1 ¼ 400:119N
0:8598
ð7:18Þ
In relationships (7.17) and (7.18), the values of SIR parameter N must be taken
in millions. These approximate formulas can be useful to control new SIR simulations due to the high levels of F=F C ratio. But they contain a priori unknown
parameter N (its values can be estimated with the use of the procedure proposed in
Chap. 5). In comparison, formulas (7.3)–(7.6) allow estimating the values of epidemic parameters without any new SIR simulations. The relative characteristics
based on known values N pop and calculated with the use of data from Table 7.1 are
presented in Table 7.4. Later we will show the corresponding characteristics for
many other countries and compare with the estimations (7.5) and (7.6).
Table 7.4 demonstrates that the lowest values of V 1 =N pop were predicted for
China and South Korea. The first waves of epidemic in these countries have finished
with figures of V f =N pop which are slightly higher than predicted (the relative error e is
low). As of September 26, 2020, the values V A =N pop did not sufficiently exceed the
V f =N pop ones. It means that next waves of the pandemic in these two countries were
very moderate. In Ukraine, Moldova, Kyiv and in the world, predicted values of
V 1 =N pop were much higher. The first waves of epidemic in these countries have
finished (or even continue) with figures of V f =N pop which are much higher than
predicted ones (the relative error e is very high). It means that these countries probably
had problems with detection and isolation of infected persons. As of September 26,
2020, the values V A =N pop dramatically exceeded the V f =N pop ones (prediction 8 for
Table 7.4 Relative epidemic characteristics for different countries, regions and predictions
calculated in with the use of Table 7.1
Country or
region, number
of prediction
N/N pop
a Á N pop
(day)
−1
V 1 =N pop
V f =N pop
e (%)
V A =N pop
World, 2
0.0031
104.8
0.000915
>0.00431
>78.8
0.00431
China, 2
9.715e-05
6.167
5.64e-05
5.86e-05
3.8
6.31e-05
South Korea, 2
0.000267
984.4
0.000211
0.000250
15.3
0.000461
Ukraine, 8
0.00135
202.0
0.000648
0.00595
89.3
0.00454
USA
0.02140
36.1
0.00448
0.0205
78.2
0.0210
Germany, 2
0.01053
78.5
0.00211
0.00253
16.5
0.00340
UK
0.00707
62.1
0.00317
0.00475
33.4
0.00632
Italy, 4
0.01869
40.9
0.00373
0.00423
11.7
0.00510
Spain, 2
0.01626
50.0
0.00473
0.00539
12.3
0.0153
France, 2
0.01057
128.6
0.00199
0.00237
16.0
0.00772
Austria, 6
0.00835
173.0
0.00168
0.00180
6.6
0.00477
Moldova, 2
0.00151
307.9
0.000879
0.00304
71.1
0.0125
Kyiv, 2
0.00101
355.8
0.000651
0.00179
63.6
0.00730
96
7 Comparison of the First Waves of the COVID-19 …