

420
A. R. Tom
13.4.2.6 Progressivity
The progressivity of the four regimes under evaluation was measured by
estimating the AETR over a range of different pre-tax IRR and the corresponding pre-tax IRRs for the developments. The theoretical R-factor
regime was observed to be more progressive than the DROP PSAs. This
is due to the utilization of the R-factor that increases the Government
take as the project costs are recovered, and the profitability increases. The
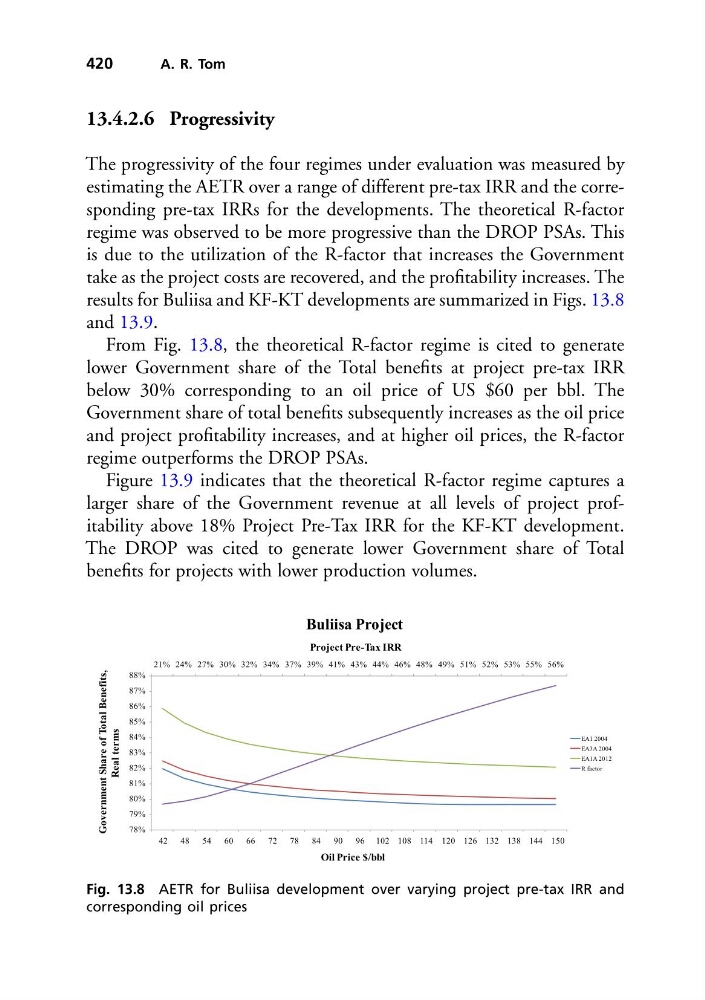
results for Buliisa and KF-KT developments are summarized in Figs. 13.8
and 13.9.
From Fig. 13.8, the theoretical R-factor regime is cited to generate
lower Government share of the Total benefits at project pre-tax IRR
below 30% corresponding to an oil price of US $60 per bbl. The
Government share of total benefits subsequently increases as the oil price
and project profitability increases, and at higher oil prices, the R-factor
regime outperforms the DROP PSAs.
Figure 13.9 indicates that the theoretical R-factor regime captures a
larger share of the Government revenue at all levels of project profitability above 18% Project Pre-Tax IRR for the KF-KT development.
The DROP was cited to generate lower Government share of Total
benefits for projects with lower production volumes.
21% 24% 27% 30% 32% 34% 37% 39% 41% 43% 44% 46% 48% 49% 51% 52% 53% 55% 56%
78%
79%
80%
81%
82%
83%
84%
85%
86%
87%
88%
42
48
54
60
66
72
78
84
90
96 102 108 114 120 126 132 138 144 150
Project Pre-Tax IRR
Government Share of Total Benefits,
Real terms
Oil Price $/bbl
Buliisa Project
EA1 2004
EA3A 2004
EA1A 2012
R factor
Fig. 13.8 AETR for Buliisa development over varying project pre-tax IRR and
corresponding oil prices
A. R. Tom
13.4.2.6 Progressivity
The progressivity of the four regimes under evaluation was measured by
estimating the AETR over a range of different pre-tax IRR and the corresponding pre-tax IRRs for the developments. The theoretical R-factor
regime was observed to be more progressive than the DROP PSAs. This
is due to the utilization of the R-factor that increases the Government
take as the project costs are recovered, and the profitability increases. The
results for Buliisa and KF-KT developments are summarized in Figs. 13.8
and 13.9.
From Fig. 13.8, the theoretical R-factor regime is cited to generate
lower Government share of the Total benefits at project pre-tax IRR
below 30% corresponding to an oil price of US $60 per bbl. The
Government share of total benefits subsequently increases as the oil price
and project profitability increases, and at higher oil prices, the R-factor
regime outperforms the DROP PSAs.
Figure 13.9 indicates that the theoretical R-factor regime captures a
larger share of the Government revenue at all levels of project profitability above 18% Project Pre-Tax IRR for the KF-KT development.
The DROP was cited to generate lower Government share of Total
benefits for projects with lower production volumes.
21% 24% 27% 30% 32% 34% 37% 39% 41% 43% 44% 46% 48% 49% 51% 52% 53% 55% 56%
78%
79%
80%
81%
82%
83%
84%
85%
86%
87%
88%
42
48
54
60
66
72
78
84
90
96 102 108 114 120 126 132 138 144 150
Project Pre-Tax IRR
Government Share of Total Benefits,
Real terms
Oil Price $/bbl
Buliisa Project
EA1 2004
EA3A 2004
EA1A 2012
R factor
Fig. 13.8 AETR for Buliisa development over varying project pre-tax IRR and
corresponding oil prices