

12.2 Analysis of the Crystalline Structure 285
case, the wavelength of the electrons is always sufficiently short to obtain useful
diffraction patterns. This difference between X-ray and electron diffraction is also
the reason for the sometimes-disturbing finding that one does not find an X-ray
diffraction pattern, but a relatively good electron diffraction pattern. The reason
is found in the different wavelengths: X-ray diffraction is usually done with Cu
Kα radiation having a wavelength of 0.154 nm, for electron diffraction, in most
cases, an energy around 100 keV, equivalent to a wavelength of 3.7 × 10
–3 nm, is
selected.
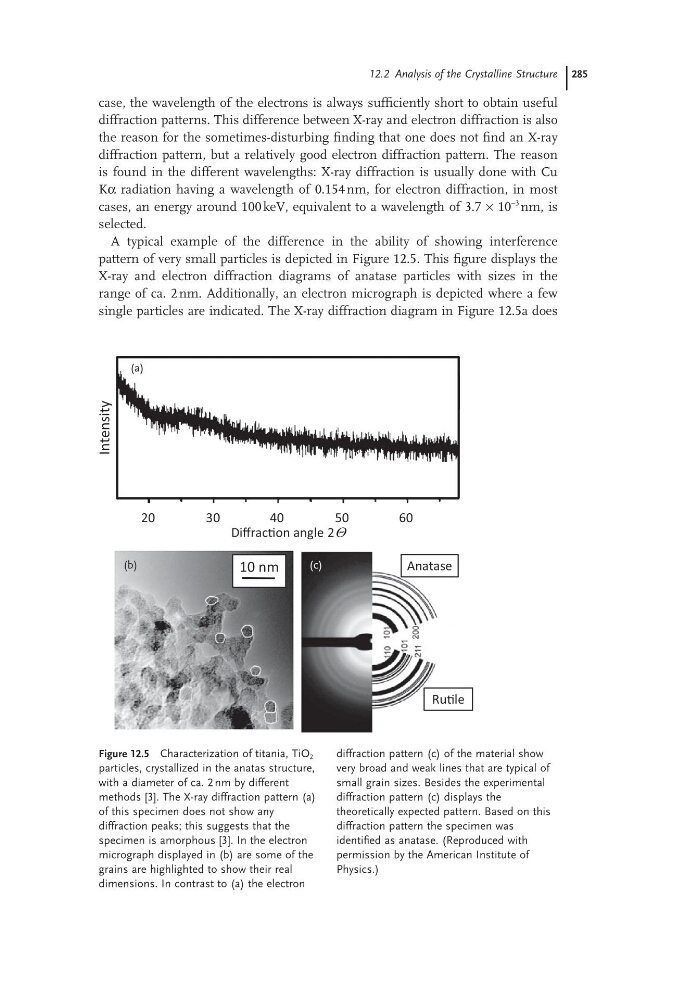
A typical example of the difference in the ability of showing interference
pattern of very small particles is depicted in Figure 12.5. This figure displays the
X-ray and electron diffraction diagrams of anatase particles with sizes in the
range of ca. 2 nm. Additionally, an electron micrograph is depicted where a few
single particles are indicated. The X-ray diffraction diagram in Figure 12.5a does
Figure 12.5 Characterization of titania, TiO 2
particles, crystallized in the anatas structure,
with a diameter of ca. 2 nm by different
methods [3]. The X-ray diffraction pattern (a)
of this specimen does not show any
diffraction peaks; this suggests that the
specimen is amorphous [3]. In the electron
micrograph displayed in (b) are some of the
grains are highlighted to show their real
dimensions. In contrast to (a) the electron
diffraction pattern (c) of the material show
very broad and weak lines that are typical of
small grain sizes. Besides the experimental
diffraction pattern (c) displays the
theoretically expected pattern. Based on this
diffraction pattern the specimen was
identified as anatase. (Reproduced with
permission by the American Institute of
Physics.)
Intensity
20
30
40
50
60
DiffracƟon angle 2Θ
Anatase
RuƟle
10 nm
(a)
(b)
(c)
case, the wavelength of the electrons is always sufficiently short to obtain useful
diffraction patterns. This difference between X-ray and electron diffraction is also
the reason for the sometimes-disturbing finding that one does not find an X-ray
diffraction pattern, but a relatively good electron diffraction pattern. The reason
is found in the different wavelengths: X-ray diffraction is usually done with Cu
Kα radiation having a wavelength of 0.154 nm, for electron diffraction, in most
cases, an energy around 100 keV, equivalent to a wavelength of 3.7 × 10
–3 nm, is
selected.
A typical example of the difference in the ability of showing interference
pattern of very small particles is depicted in Figure 12.5. This figure displays the
X-ray and electron diffraction diagrams of anatase particles with sizes in the
range of ca. 2 nm. Additionally, an electron micrograph is depicted where a few
single particles are indicated. The X-ray diffraction diagram in Figure 12.5a does
Figure 12.5 Characterization of titania, TiO 2
particles, crystallized in the anatas structure,
with a diameter of ca. 2 nm by different
methods [3]. The X-ray diffraction pattern (a)
of this specimen does not show any
diffraction peaks; this suggests that the
specimen is amorphous [3]. In the electron
micrograph displayed in (b) are some of the
grains are highlighted to show their real
dimensions. In contrast to (a) the electron
diffraction pattern (c) of the material show
very broad and weak lines that are typical of
small grain sizes. Besides the experimental
diffraction pattern (c) displays the
theoretically expected pattern. Based on this
diffraction pattern the specimen was
identified as anatase. (Reproduced with
permission by the American Institute of
Physics.)
Intensity
20
30
40
50
60
DiffracƟon angle 2Θ
Anatase
RuƟle
10 nm
(a)
(b)
(c)