

282 12 Characterization of Nanomaterials
Avogadro’s number. The specific surface of a specimen A with the weight m is
then given by:
A
N a
m
=
S M .
(12.5)
The quantity a M is the area covered by one molecule. In the case of nitrogen, this
value is a M = 0.158 nm
2 .
As already mentioned, the surface areas of technical nanopowders are in most
examples in the range between 50 and 100 m
2 g
−1 . Only in special cases, where the
material does form compact particles, can the specific surface area exceed even
1000 m
2 g
−1
.
12.2
Analysis of the Crystalline Structure
Analyzing the crystalline structure of nanoparticles, or nanomaterials in general,
is of great importance, as these small particles often have different structures to
their bulk counterpart (see Chapter 7). However, as the particles are small, analysis
of the structure faces a series of problems. In general, diffraction techniques using
X-rays or electrons are applied. These methods of analysis provide information on
the crystallographic structure and, additionally, some information on the particle
size. The physical background of diffraction is found in the wave nature of electrons and X-rays. Provided these waves are in an appropriate range of wavelength
relative to the lattice structure of the specimen, one obtains a diffraction pattern
that is typical of the structure of the particles. With decreasing particle size, the
lines in the diffraction patterns are broadened; therefore, sometimes an unequivocal assignment of a structure is difficult or even impossible. A typical example is
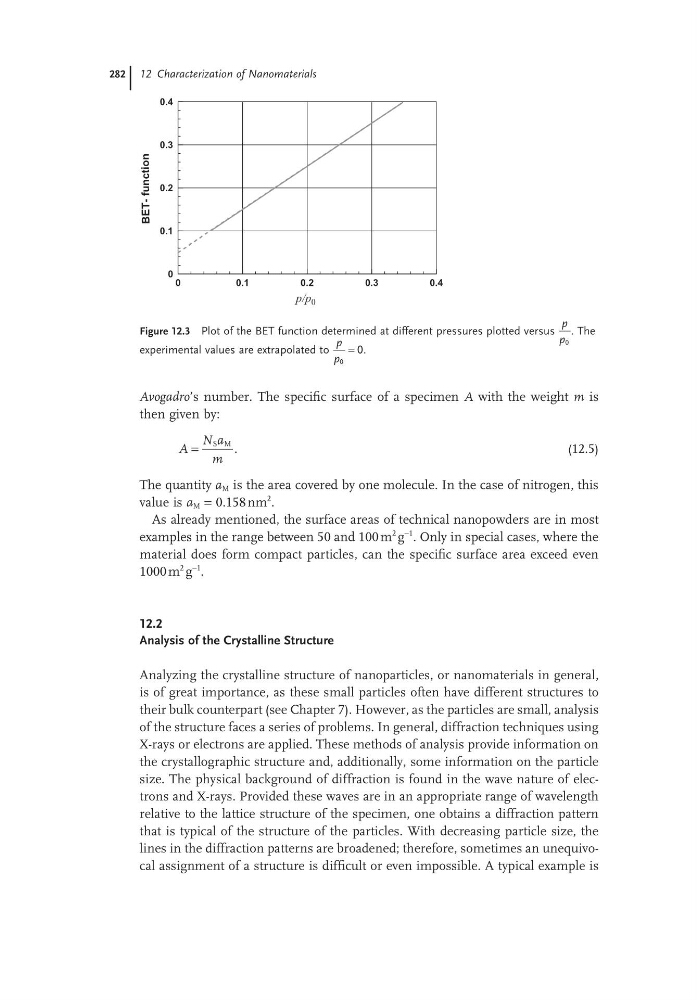
Figure 12.3 Plot of the BET function determined at different pressures plotted versus
p
p 0
. The
experimental values are extrapolated to
p
p 0
0
= .
0
0.1
0.2
0.3
0.4
p/p 0
0
0.1
0.2
0.3
0.4
BETfunction
Avogadro’s number. The specific surface of a specimen A with the weight m is
then given by:
A
N a
m
=
S M .
(12.5)
The quantity a M is the area covered by one molecule. In the case of nitrogen, this
value is a M = 0.158 nm
2 .
As already mentioned, the surface areas of technical nanopowders are in most
examples in the range between 50 and 100 m
2 g
−1 . Only in special cases, where the
material does form compact particles, can the specific surface area exceed even
1000 m
2 g
−1
.
12.2
Analysis of the Crystalline Structure
Analyzing the crystalline structure of nanoparticles, or nanomaterials in general,
is of great importance, as these small particles often have different structures to
their bulk counterpart (see Chapter 7). However, as the particles are small, analysis
of the structure faces a series of problems. In general, diffraction techniques using
X-rays or electrons are applied. These methods of analysis provide information on
the crystallographic structure and, additionally, some information on the particle
size. The physical background of diffraction is found in the wave nature of electrons and X-rays. Provided these waves are in an appropriate range of wavelength
relative to the lattice structure of the specimen, one obtains a diffraction pattern
that is typical of the structure of the particles. With decreasing particle size, the
lines in the diffraction patterns are broadened; therefore, sometimes an unequivocal assignment of a structure is difficult or even impossible. A typical example is
Figure 12.3 Plot of the BET function determined at different pressures plotted versus
p
p 0
. The
experimental values are extrapolated to
p
p 0
0
= .
0
0.1
0.2
0.3
0.4
p/p 0
0
0.1
0.2
0.3
0.4
BETfunction