

276 11 Mechanical Properties
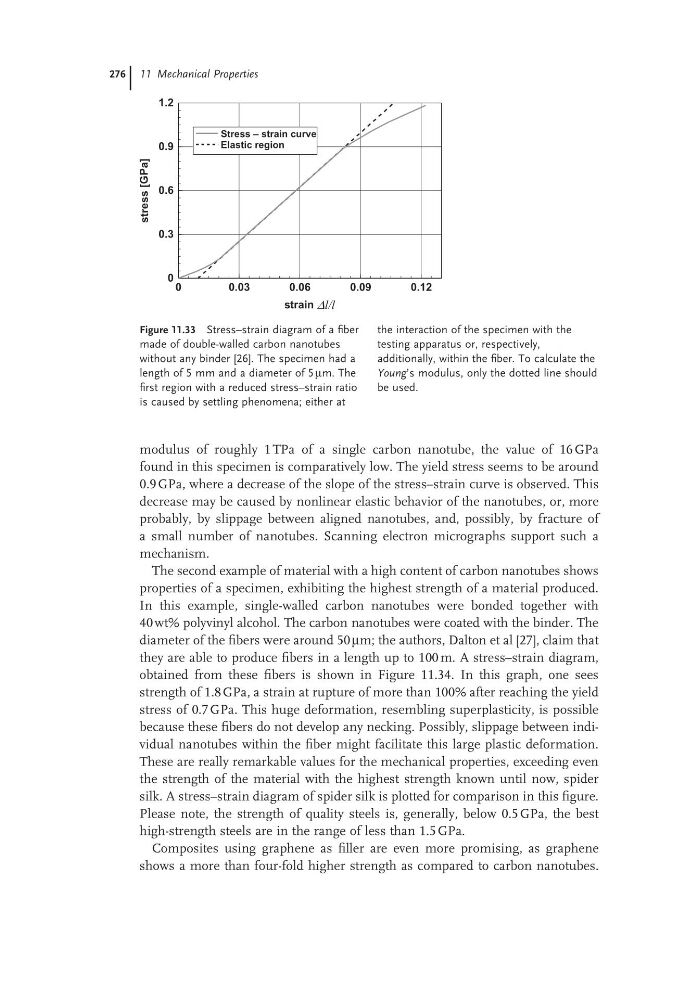
modulus of roughly 1 TPa of a single carbon nanotube, the value of 16 GPa
found in this specimen is comparatively low. The yield stress seems to be around
0.9 GPa, where a decrease of the slope of the stress–strain curve is observed. This
decrease may be caused by nonlinear elastic behavior of the nanotubes, or, more
probably, by slippage between aligned nanotubes, and, possibly, by fracture of
a small number of nanotubes. Scanning electron micrographs support such a
mechanism.
The second example of material with a high content of carbon nanotubes shows
properties of a specimen, exhibiting the highest strength of a material produced.
In this example, single-walled carbon nanotubes were bonded together with
40 wt% polyvinyl alcohol. The carbon nanotubes were coated with the binder. The
diameter of the fibers were around 50 μm; the authors, Dalton et al [27], claim that
they are able to produce fibers in a length up to 100 m. A stress–strain diagram,
obtained from these fibers is shown in Figure 11.34. In this graph, one sees
strength of 1.8 GPa, a strain at rupture of more than 100% after reaching the yield
stress of 0.7 GPa. This huge deformation, resembling superplasticity, is possible
because these fibers do not develop any necking. Possibly, slippage between individual nanotubes within the fiber might facilitate this large plastic deformation.
These are really remarkable values for the mechanical properties, exceeding even
the strength of the material with the highest strength known until now, spider
silk. A stress–strain diagram of spider silk is plotted for comparison in this figure.
Please note, the strength of quality steels is, generally, below 0.5 GPa, the best
high-strength steels are in the range of less than 1.5 GPa.
Composites using graphene as filler are even more promising, as graphene
shows a more than four-fold higher strength as compared to carbon nanotubes.
Figure 11.33 Stress–strain diagram of a fiber
made of double-walled carbon nanotubes
without any binder [26]. The specimen had a
length of 5 mm and a diameter of 5 μm. The
first region with a reduced stress–strain ratio
is caused by settling phenomena; either at
the interaction of the specimen with the
testing apparatus or, respectively,
additionally, within the fiber. To calculate the
Young’s modulus, only the dotted line should
be used.
0
0.03
0.06
0.09
0.12
strain ∆l/l
0
0.3
0.6
0.9
1.2
stress
[GPa]
Stress – strain curve
Elastic region
modulus of roughly 1 TPa of a single carbon nanotube, the value of 16 GPa
found in this specimen is comparatively low. The yield stress seems to be around
0.9 GPa, where a decrease of the slope of the stress–strain curve is observed. This
decrease may be caused by nonlinear elastic behavior of the nanotubes, or, more
probably, by slippage between aligned nanotubes, and, possibly, by fracture of
a small number of nanotubes. Scanning electron micrographs support such a
mechanism.
The second example of material with a high content of carbon nanotubes shows
properties of a specimen, exhibiting the highest strength of a material produced.
In this example, single-walled carbon nanotubes were bonded together with
40 wt% polyvinyl alcohol. The carbon nanotubes were coated with the binder. The
diameter of the fibers were around 50 μm; the authors, Dalton et al [27], claim that
they are able to produce fibers in a length up to 100 m. A stress–strain diagram,
obtained from these fibers is shown in Figure 11.34. In this graph, one sees
strength of 1.8 GPa, a strain at rupture of more than 100% after reaching the yield
stress of 0.7 GPa. This huge deformation, resembling superplasticity, is possible
because these fibers do not develop any necking. Possibly, slippage between individual nanotubes within the fiber might facilitate this large plastic deformation.
These are really remarkable values for the mechanical properties, exceeding even
the strength of the material with the highest strength known until now, spider
silk. A stress–strain diagram of spider silk is plotted for comparison in this figure.
Please note, the strength of quality steels is, generally, below 0.5 GPa, the best
high-strength steels are in the range of less than 1.5 GPa.
Composites using graphene as filler are even more promising, as graphene
shows a more than four-fold higher strength as compared to carbon nanotubes.
Figure 11.33 Stress–strain diagram of a fiber
made of double-walled carbon nanotubes
without any binder [26]. The specimen had a
length of 5 mm and a diameter of 5 μm. The
first region with a reduced stress–strain ratio
is caused by settling phenomena; either at
the interaction of the specimen with the
testing apparatus or, respectively,
additionally, within the fiber. To calculate the
Young’s modulus, only the dotted line should
be used.
0
0.03
0.06
0.09
0.12
strain ∆l/l
0
0.3
0.6
0.9
1.2
stress
[GPa]
Stress – strain curve
Elastic region