

262 11 Mechanical Properties
deformation rate, stress, and grain size are more complex compared to the other
deformation mechanisms, it must be noted that the deformation rate is proportional to d
–3
.
As the mechanisms of Coble and Ashby–Verall show the same grain-size dependency, it is quite difficult to decide which one of these mechanisms is acting. By
comparison of Vickers hardness measurements on TiAl specimens with model
calculations, Chang et al. [9]. proved the validity of the Ashby–Verall process for
the deformation process of nanocrystalline intermetallcs experimentally. Figure
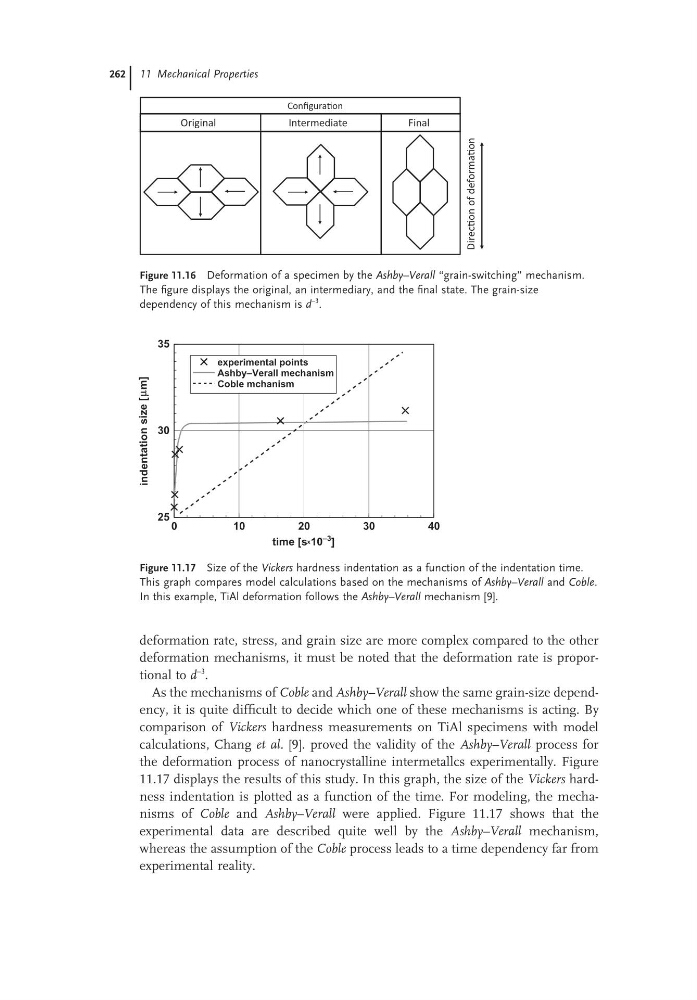
11.17 displays the results of this study. In this graph, the size of the Vickers hardness indentation is plotted as a function of the time. For modeling, the mechanisms of Coble and Ashby–Verall were applied. Figure 11.17 shows that the
experimental data are described quite well by the Ashby–Verall mechanism,
whereas the assumption of the Coble process leads to a time dependency far from
experimental reality.
Figure 11.16 Deformation of a specimen by the Ashby–Verall “grain-switching” mechanism.
The figure displays the original, an intermediary, and the final state. The grain-size
dependency of this mechanism is d
−3 .
DirecƟon of deformaƟon
Original
Intermediate
Final
ConfiguraƟon
Figure 11.17 Size of the Vickers hardness indentation as a function of the indentation time.
This graph compares model calculations based on the mechanisms of Ashby–Verall and Coble.
In this example, TiAl deformation follows the Ashby–Verall mechanism [9].
0
10
20
30
40
time [s x 10
–3 ]
25
30
35
indentation
size
[µm]
experimental points
Ashby–Verall mechanism
Coble mchanism
deformation rate, stress, and grain size are more complex compared to the other
deformation mechanisms, it must be noted that the deformation rate is proportional to d
–3
.
As the mechanisms of Coble and Ashby–Verall show the same grain-size dependency, it is quite difficult to decide which one of these mechanisms is acting. By
comparison of Vickers hardness measurements on TiAl specimens with model
calculations, Chang et al. [9]. proved the validity of the Ashby–Verall process for
the deformation process of nanocrystalline intermetallcs experimentally. Figure
11.17 displays the results of this study. In this graph, the size of the Vickers hardness indentation is plotted as a function of the time. For modeling, the mechanisms of Coble and Ashby–Verall were applied. Figure 11.17 shows that the
experimental data are described quite well by the Ashby–Verall mechanism,
whereas the assumption of the Coble process leads to a time dependency far from
experimental reality.
Figure 11.16 Deformation of a specimen by the Ashby–Verall “grain-switching” mechanism.
The figure displays the original, an intermediary, and the final state. The grain-size
dependency of this mechanism is d
−3 .
DirecƟon of deformaƟon
Original
Intermediate
Final
ConfiguraƟon
Figure 11.17 Size of the Vickers hardness indentation as a function of the indentation time.
This graph compares model calculations based on the mechanisms of Ashby–Verall and Coble.
In this example, TiAl deformation follows the Ashby–Verall mechanism [9].
0
10
20
30
40
time [s x 10
–3 ]
25
30
35
indentation
size
[µm]
experimental points
Ashby–Verall mechanism
Coble mchanism