

10.4 Electrical Conductivity of Nanocomposites 245
these are weak binding forces, it is possible to singularize these fibers by sonification. However, during this process, the length of the fibers is reduced to values
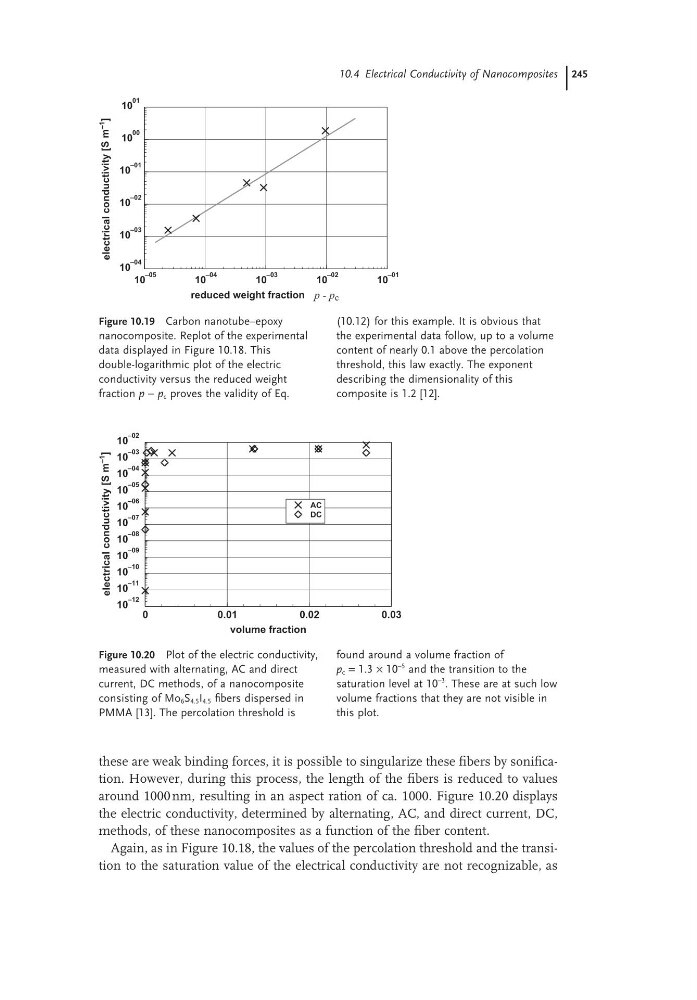
around 1000 nm, resulting in an aspect ration of ca. 1000. Figure 10.20 displays
the electric conductivity, determined by alternating, AC, and direct current, DC,
methods, of these nanocomposites as a function of the fiber content.
Again, as in Figure 10.18, the values of the percolation threshold and the transition to the saturation value of the electrical conductivity are not recognizable, as
Figure 10.19 Carbon nanotube–epoxy
nanocomposite. Replot of the experimental
data displayed in Figure 10.18. This
double-logarithmic plot of the electric
conductivity versus the reduced weight
fraction p − p c proves the validity of Eq.
(10.12) for this example. It is obvious that
the experimental data follow, up to a volume
content of nearly 0.1 above the percolation
threshold, this law exactly. The exponent
describing the dimensionality of this
composite is 1.2 [12].
10
–05
10
–04
10
–03
10
–02
10
–01
reduced weight fraction p - p c
10
–04
10
–03
10
–02
10
–01
10
00
10
01
electrical
conductivity
[S
m
–1
]
Figure 10.20 Plot of the electric conductivity,
measured with alternating, AC and direct
current, DC methods, of a nanocomposite
consisting of Mo 6 S 4.5 I 4.5 fibers dispersed in
PMMA [13]. The percolation threshold is
found around a volume fraction of
p c = 1.3 × 10
−5 and the transition to the
saturation level at 10
−3 . These are at such low
volume fractions that they are not visible in
this plot.
0
0.01
0.02
0.03
volume fraction
10
–12
10
–11
10
–10
10
–09
10
–08
10
–07
10
–06
10
–05
10
–04
10
–03
10
–02
electrical
conductivity
[S
m
–1
]
AC
DC
these are weak binding forces, it is possible to singularize these fibers by sonification. However, during this process, the length of the fibers is reduced to values
around 1000 nm, resulting in an aspect ration of ca. 1000. Figure 10.20 displays
the electric conductivity, determined by alternating, AC, and direct current, DC,
methods, of these nanocomposites as a function of the fiber content.
Again, as in Figure 10.18, the values of the percolation threshold and the transition to the saturation value of the electrical conductivity are not recognizable, as
Figure 10.19 Carbon nanotube–epoxy
nanocomposite. Replot of the experimental
data displayed in Figure 10.18. This
double-logarithmic plot of the electric
conductivity versus the reduced weight
fraction p − p c proves the validity of Eq.
(10.12) for this example. It is obvious that
the experimental data follow, up to a volume
content of nearly 0.1 above the percolation
threshold, this law exactly. The exponent
describing the dimensionality of this
composite is 1.2 [12].
10
–05
10
–04
10
–03
10
–02
10
–01
reduced weight fraction p - p c
10
–04
10
–03
10
–02
10
–01
10
00
10
01
electrical
conductivity
[S
m
–1
]
Figure 10.20 Plot of the electric conductivity,
measured with alternating, AC and direct
current, DC methods, of a nanocomposite
consisting of Mo 6 S 4.5 I 4.5 fibers dispersed in
PMMA [13]. The percolation threshold is
found around a volume fraction of
p c = 1.3 × 10
−5 and the transition to the
saturation level at 10
−3 . These are at such low
volume fractions that they are not visible in
this plot.
0
0.01
0.02
0.03
volume fraction
10
–12
10
–11
10
–10
10
–09
10
–08
10
–07
10
–06
10
–05
10
–04
10
–03
10
–02
electrical
conductivity
[S
m
–1
]
AC
DC