

244 10 Electrical Properties
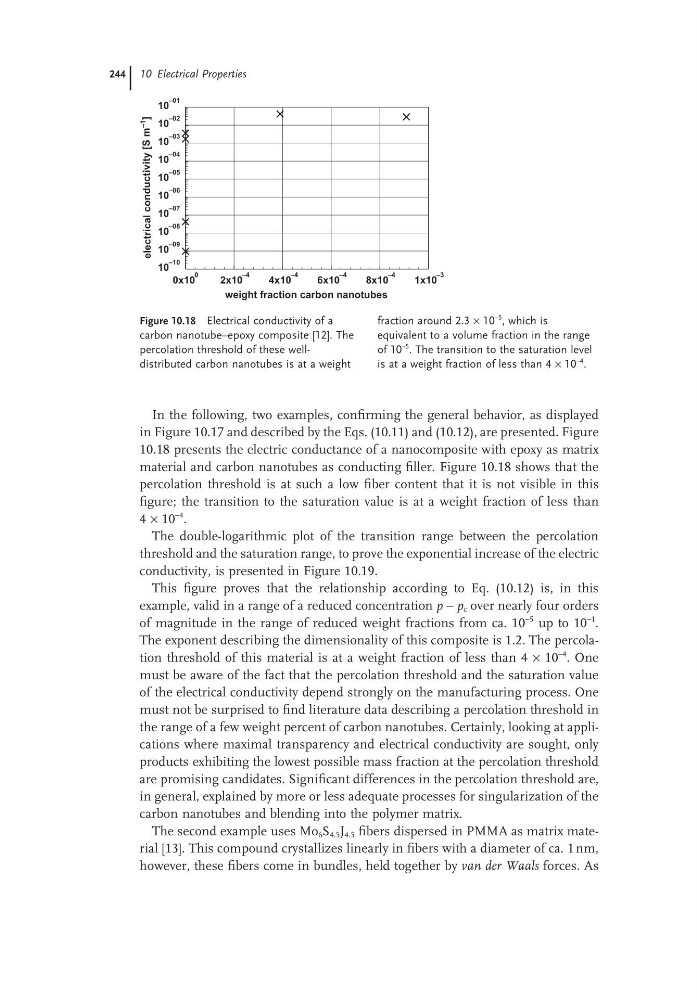
Figure 10.18 Electrical conductivity of a
carbon nanotube–epoxy composite [12]. The
percolation threshold of these welldistributed carbon nanotubes is at a weight
fraction around 2.3 × 10
−5
, which is
equivalent to a volume fraction in the range
of 10
−5 . The transition to the saturation level
is at a weight fraction of less than 4 × 10
−4
.
0x10
0
2x10
–4
4x10
–4
6x10
–4
8x10
–4
1x10
–3
weight fraction carbon nanotubes
10
–10
10
–09
10
–08
10
–07
10
–06
10
–05
10
–04
10
–03
10
–02
10
–01
electrical
conductivity
[S
m
–1
]
In the following, two examples, confirming the general behavior, as displayed
in Figure 10.17 and described by the Eqs. (10.11) and (10.12), are presented. Figure
10.18 presents the electric conductance of a nanocomposite with epoxy as matrix
material and carbon nanotubes as conducting filler. Figure 10.18 shows that the
percolation threshold is at such a low fiber content that it is not visible in this
figure; the transition to the saturation value is at a weight fraction of less than
4 × 10
−4 .
The double-logarithmic plot of the transition range between the percolation
threshold and the saturation range, to prove the exponential increase of the electric
conductivity, is presented in Figure 10.19.
This figure proves that the relationship according to Eq. (10.12) is, in this
example, valid in a range of a reduced concentration p − p c over nearly four orders
of magnitude in the range of reduced weight fractions from ca. 10
−5 up to 10
−1 .
The exponent describing the dimensionality of this composite is 1.2. The percolation threshold of this material is at a weight fraction of less than 4 × 10
−4 . One
must be aware of the fact that the percolation threshold and the saturation value
of the electrical conductivity depend strongly on the manufacturing process. One
must not be surprised to find literature data describing a percolation threshold in
the range of a few weight percent of carbon nanotubes. Certainly, looking at applications where maximal transparency and electrical conductivity are sought, only
products exhibiting the lowest possible mass fraction at the percolation threshold
are promising candidates. Significant differences in the percolation threshold are,
in general, explained by more or less adequate processes for singularization of the
carbon nanotubes and blending into the polymer matrix.
The second example uses Mo 6 S 4.5 J 4.5 fibers dispersed in PMMA as matrix material [13]. This compound crystallizes linearly in fibers with a diameter of ca. 1 nm,
however, these fibers come in bundles, held together by van der Waals forces. As
Figure 10.18 Electrical conductivity of a
carbon nanotube–epoxy composite [12]. The
percolation threshold of these welldistributed carbon nanotubes is at a weight
fraction around 2.3 × 10
−5
, which is
equivalent to a volume fraction in the range
of 10
−5 . The transition to the saturation level
is at a weight fraction of less than 4 × 10
−4
.
0x10
0
2x10
–4
4x10
–4
6x10
–4
8x10
–4
1x10
–3
weight fraction carbon nanotubes
10
–10
10
–09
10
–08
10
–07
10
–06
10
–05
10
–04
10
–03
10
–02
10
–01
electrical
conductivity
[S
m
–1
]
In the following, two examples, confirming the general behavior, as displayed
in Figure 10.17 and described by the Eqs. (10.11) and (10.12), are presented. Figure
10.18 presents the electric conductance of a nanocomposite with epoxy as matrix
material and carbon nanotubes as conducting filler. Figure 10.18 shows that the
percolation threshold is at such a low fiber content that it is not visible in this
figure; the transition to the saturation value is at a weight fraction of less than
4 × 10
−4 .
The double-logarithmic plot of the transition range between the percolation
threshold and the saturation range, to prove the exponential increase of the electric
conductivity, is presented in Figure 10.19.
This figure proves that the relationship according to Eq. (10.12) is, in this
example, valid in a range of a reduced concentration p − p c over nearly four orders
of magnitude in the range of reduced weight fractions from ca. 10
−5 up to 10
−1 .
The exponent describing the dimensionality of this composite is 1.2. The percolation threshold of this material is at a weight fraction of less than 4 × 10
−4 . One
must be aware of the fact that the percolation threshold and the saturation value
of the electrical conductivity depend strongly on the manufacturing process. One
must not be surprised to find literature data describing a percolation threshold in
the range of a few weight percent of carbon nanotubes. Certainly, looking at applications where maximal transparency and electrical conductivity are sought, only
products exhibiting the lowest possible mass fraction at the percolation threshold
are promising candidates. Significant differences in the percolation threshold are,
in general, explained by more or less adequate processes for singularization of the
carbon nanotubes and blending into the polymer matrix.
The second example uses Mo 6 S 4.5 J 4.5 fibers dispersed in PMMA as matrix material [13]. This compound crystallizes linearly in fibers with a diameter of ca. 1 nm,
however, these fibers come in bundles, held together by van der Waals forces. As