

198 9 Optical Properties
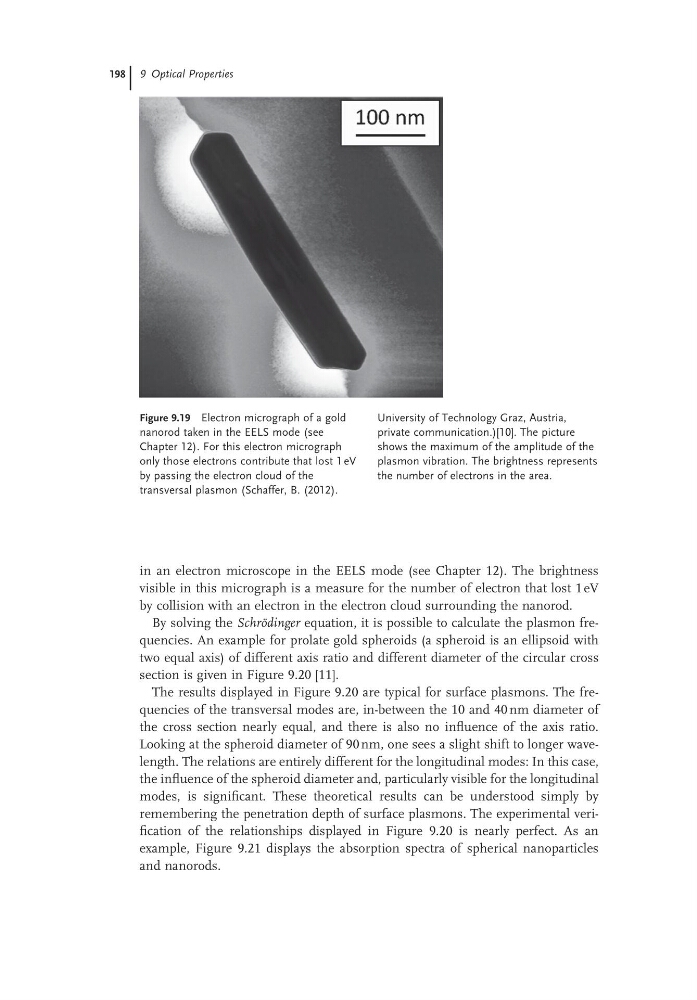
in an electron microscope in the EELS mode (see Chapter 12). The brightness
visible in this micrograph is a measure for the number of electron that lost 1 eV
by collision with an electron in the electron cloud surrounding the nanorod.
By solving the Schrödinger equation, it is possible to calculate the plasmon frequencies. An example for prolate gold spheroids (a spheroid is an ellipsoid with
two equal axis) of different axis ratio and different diameter of the circular cross
section is given in Figure 9.20 [11].
The results displayed in Figure 9.20 are typical for surface plasmons. The frequencies of the transversal modes are, in-between the 10 and 40 nm diameter of
the cross section nearly equal, and there is also no influence of the axis ratio.
Looking at the spheroid diameter of 90 nm, one sees a slight shift to longer wavelength. The relations are entirely different for the longitudinal modes: In this case,
the influence of the spheroid diameter and, particularly visible for the longitudinal
modes, is significant. These theoretical results can be understood simply by
remembering the penetration depth of surface plasmons. The experimental verification of the relationships displayed in Figure 9.20 is nearly perfect. As an
example, Figure 9.21 displays the absorption spectra of spherical nanoparticles
and nanorods.
Figure 9.19 Electron micrograph of a gold
nanorod taken in the EELS mode (see
Chapter 12). For this electron micrograph
only those electrons contribute that lost 1 eV
by passing the electron cloud of the
transversal plasmon (Schaffer, B. (2012).
University of Technology Graz, Austria,
private communication.)[10]. The picture
shows the maximum of the amplitude of the
plasmon vibration. The brightness represents
the number of electrons in the area.
in an electron microscope in the EELS mode (see Chapter 12). The brightness
visible in this micrograph is a measure for the number of electron that lost 1 eV
by collision with an electron in the electron cloud surrounding the nanorod.
By solving the Schrödinger equation, it is possible to calculate the plasmon frequencies. An example for prolate gold spheroids (a spheroid is an ellipsoid with
two equal axis) of different axis ratio and different diameter of the circular cross
section is given in Figure 9.20 [11].
The results displayed in Figure 9.20 are typical for surface plasmons. The frequencies of the transversal modes are, in-between the 10 and 40 nm diameter of
the cross section nearly equal, and there is also no influence of the axis ratio.
Looking at the spheroid diameter of 90 nm, one sees a slight shift to longer wavelength. The relations are entirely different for the longitudinal modes: In this case,
the influence of the spheroid diameter and, particularly visible for the longitudinal
modes, is significant. These theoretical results can be understood simply by
remembering the penetration depth of surface plasmons. The experimental verification of the relationships displayed in Figure 9.20 is nearly perfect. As an
example, Figure 9.21 displays the absorption spectra of spherical nanoparticles
and nanorods.
Figure 9.19 Electron micrograph of a gold
nanorod taken in the EELS mode (see
Chapter 12). For this electron micrograph
only those electrons contribute that lost 1 eV
by passing the electron cloud of the
transversal plasmon (Schaffer, B. (2012).
University of Technology Graz, Austria,
private communication.)[10]. The picture
shows the maximum of the amplitude of the
plasmon vibration. The brightness represents
the number of electrons in the area.