

190 9 Optical Properties
the wavelength of the maximum of absorption gets, according to Eqs. (9.5) and
(9.9), shorter if the particles are smaller. The second observation: there is only a
minor influence of the surrounding medium on the spectrum of the absorption,
especially on the position of the maximum.
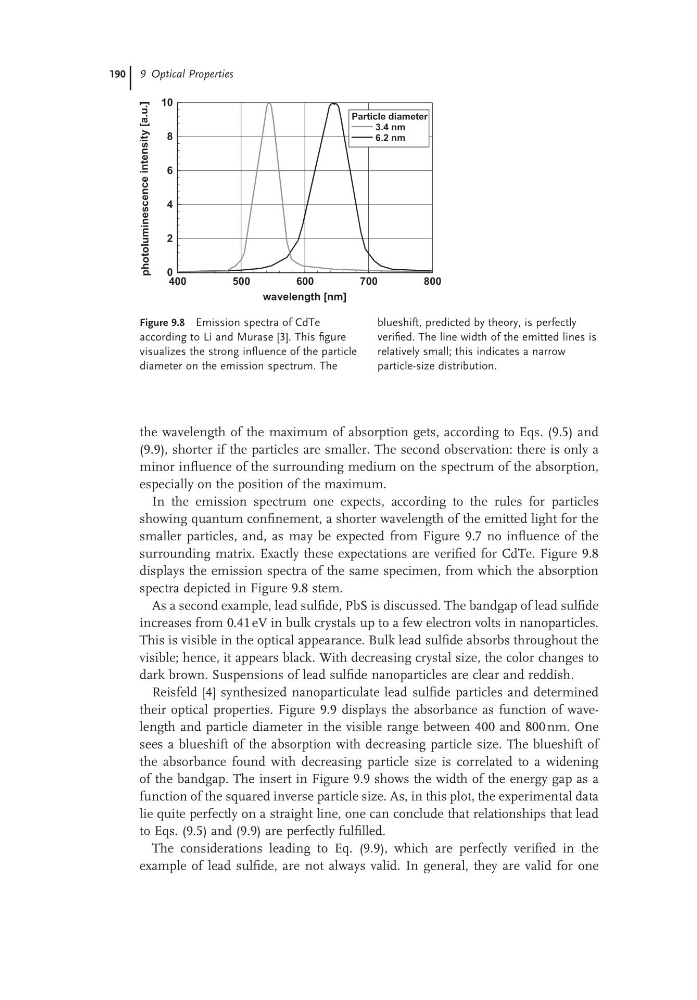
In the emission spectrum one expects, according to the rules for particles
showing quantum confinement, a shorter wavelength of the emitted light for the
smaller particles, and, as may be expected from Figure 9.7 no influence of the
surrounding matrix. Exactly these expectations are verified for CdTe. Figure 9.8
displays the emission spectra of the same specimen, from which the absorption
spectra depicted in Figure 9.8 stem.
As a second example, lead sulfide, PbS is discussed. The bandgap of lead sulfide
increases from 0.41 eV in bulk crystals up to a few electron volts in nanoparticles.
This is visible in the optical appearance. Bulk lead sulfide absorbs throughout the
visible; hence, it appears black. With decreasing crystal size, the color changes to
dark brown. Suspensions of lead sulfide nanoparticles are clear and reddish.
Reisfeld [4] synthesized nanoparticulate lead sulfide particles and determined
their optical properties. Figure 9.9 displays the absorbance as function of wavelength and particle diameter in the visible range between 400 and 800 nm. One
sees a blueshift of the absorption with decreasing particle size. The blueshift of
the absorbance found with decreasing particle size is correlated to a widening
of the bandgap. The insert in Figure 9.9 shows the width of the energy gap as a
function of the squared inverse particle size. As, in this plot, the experimental data
lie quite perfectly on a straight line, one can conclude that relationships that lead
to Eqs. (9.5) and (9.9) are perfectly fulfilled.
The considerations leading to Eq. (9.9), which are perfectly verified in the
example of lead sulfide, are not always valid. In general, they are valid for one
Figure 9.8 Emission spectra of CdTe
according to Li and Murase [3]. This figure
visualizes the strong influence of the particle
diameter on the emission spectrum. The
blueshift, predicted by theory, is perfectly
verified. The line width of the emitted lines is
relatively small; this indicates a narrow
particle-size distribution.
400
500
600
700
800
wavelength [nm]
0
2
4
6
8
10
photoluminescence
intensity
[a.u.]
Particle diameter
3.4 nm
6.2 nm
the wavelength of the maximum of absorption gets, according to Eqs. (9.5) and
(9.9), shorter if the particles are smaller. The second observation: there is only a
minor influence of the surrounding medium on the spectrum of the absorption,
especially on the position of the maximum.
In the emission spectrum one expects, according to the rules for particles
showing quantum confinement, a shorter wavelength of the emitted light for the
smaller particles, and, as may be expected from Figure 9.7 no influence of the
surrounding matrix. Exactly these expectations are verified for CdTe. Figure 9.8
displays the emission spectra of the same specimen, from which the absorption
spectra depicted in Figure 9.8 stem.
As a second example, lead sulfide, PbS is discussed. The bandgap of lead sulfide
increases from 0.41 eV in bulk crystals up to a few electron volts in nanoparticles.
This is visible in the optical appearance. Bulk lead sulfide absorbs throughout the
visible; hence, it appears black. With decreasing crystal size, the color changes to
dark brown. Suspensions of lead sulfide nanoparticles are clear and reddish.
Reisfeld [4] synthesized nanoparticulate lead sulfide particles and determined
their optical properties. Figure 9.9 displays the absorbance as function of wavelength and particle diameter in the visible range between 400 and 800 nm. One
sees a blueshift of the absorption with decreasing particle size. The blueshift of
the absorbance found with decreasing particle size is correlated to a widening
of the bandgap. The insert in Figure 9.9 shows the width of the energy gap as a
function of the squared inverse particle size. As, in this plot, the experimental data
lie quite perfectly on a straight line, one can conclude that relationships that lead
to Eqs. (9.5) and (9.9) are perfectly fulfilled.
The considerations leading to Eq. (9.9), which are perfectly verified in the
example of lead sulfide, are not always valid. In general, they are valid for one
Figure 9.8 Emission spectra of CdTe
according to Li and Murase [3]. This figure
visualizes the strong influence of the particle
diameter on the emission spectrum. The
blueshift, predicted by theory, is perfectly
verified. The line width of the emitted lines is
relatively small; this indicates a narrow
particle-size distribution.
400
500
600
700
800
wavelength [nm]
0
2
4
6
8
10
photoluminescence
intensity
[a.u.]
Particle diameter
3.4 nm
6.2 nm