

160 8 Magnetic Nanomaterials, Superparamagnetism
that are close to the surface, exhibit reduced saturation magnetization. In fact, this
reduced order is observed experimentally and theoretically well understood.
Simply stated, the spins at the surface of a magnetic nanoparticle are ordered not
as perfect as in the interior [5]. This phenomenon is called spin canting. The
surface/volume ratio of nanoparticles is a few orders of magnitude larger as compared to conventional materials; hence, the contribution of spin canting at the
surface to the magnetization is of increasing importance with decreasing particle
size. Therefore, one has to expect a significant reduction of the saturation magnetization with decreasing particle size.
As the reduction of the saturation magnetization of nanoparticles is a surface
phenomenon, it is possible to approximate it by a twozone model: an interior
perfectly ordered ferromagnetic crystal and a nonmagnetic surface layer. Assuming magnetic nanoparticles with a diameter d and a nonmagnetic surface layer
with the thickness δ, a ferromagnetic core with a diameter (d − δ) remains [6]. This
allows a reduced saturation magnetization to be approximated
M
d
d
M
nanoparticle
macroscopic
=
−
(
)
.
2
3
3
δ
(8.9)
The quantity M nanoparticle is the saturation magnetization of the specimen consisting
of nanoparticles with the diameter d and M nanoparticle the saturation magnetization
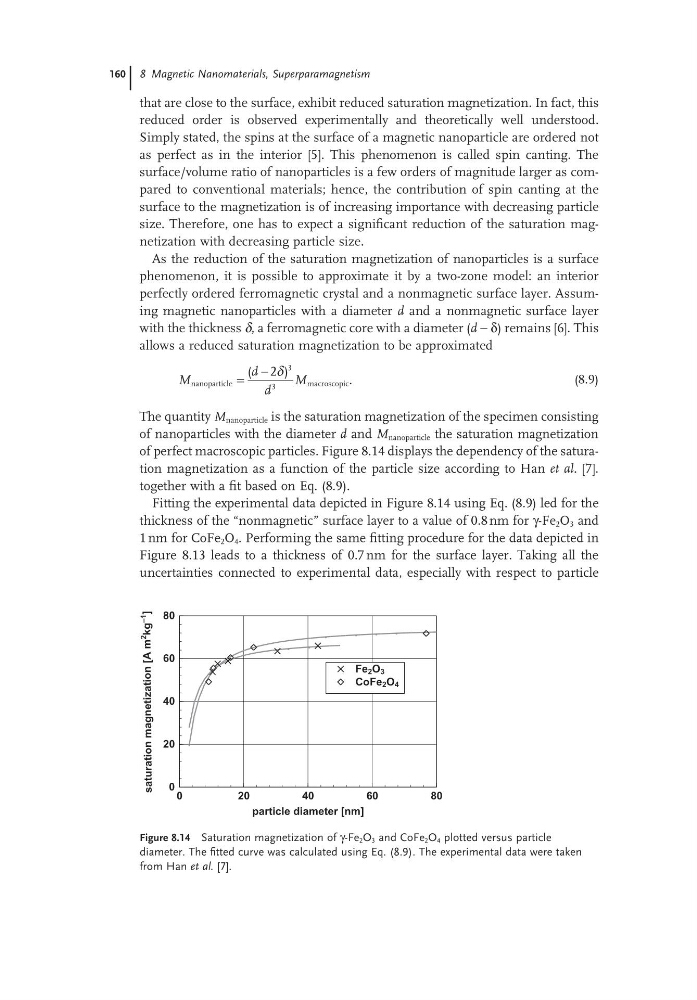
of perfect macroscopic particles. Figure 8.14 displays the dependency of the saturation magnetization as a function of the particle size according to Han et al. [7].
together with a fit based on Eq. (8.9).
Fitting the experimental data depicted in Figure 8.14 using Eq. (8.9) led for the
thickness of the “nonmagnetic” surface layer to a value of 0.8 nm for γFe 2 O 3 and
1 nm for CoFe 2 O 4 . Performing the same fitting procedure for the data depicted in
Figure 8.13 leads to a thickness of 0.7 nm for the surface layer. Taking all the
uncertainties connected to experimental data, especially with respect to particle
Figure 8.14 Saturation magnetization of γ-Fe 2 O 3 and CoFe 2 O 4 plotted versus particle
diameter. The fitted curve was calculated using Eq. (8.9). The experimental data were taken
from Han et al. [7].
0
20
40
60
80
particle diameter [nm]
0
20
40
60
80
saturation
magnetization
[A
m
2
kg
–1
]
Fe 2 O 3
CoFe 2 O 4
that are close to the surface, exhibit reduced saturation magnetization. In fact, this
reduced order is observed experimentally and theoretically well understood.
Simply stated, the spins at the surface of a magnetic nanoparticle are ordered not
as perfect as in the interior [5]. This phenomenon is called spin canting. The
surface/volume ratio of nanoparticles is a few orders of magnitude larger as compared to conventional materials; hence, the contribution of spin canting at the
surface to the magnetization is of increasing importance with decreasing particle
size. Therefore, one has to expect a significant reduction of the saturation magnetization with decreasing particle size.
As the reduction of the saturation magnetization of nanoparticles is a surface
phenomenon, it is possible to approximate it by a twozone model: an interior
perfectly ordered ferromagnetic crystal and a nonmagnetic surface layer. Assuming magnetic nanoparticles with a diameter d and a nonmagnetic surface layer
with the thickness δ, a ferromagnetic core with a diameter (d − δ) remains [6]. This
allows a reduced saturation magnetization to be approximated
M
d
d
M
nanoparticle
macroscopic
=
−
(
)
.
2
3
3
δ
(8.9)
The quantity M nanoparticle is the saturation magnetization of the specimen consisting
of nanoparticles with the diameter d and M nanoparticle the saturation magnetization
of perfect macroscopic particles. Figure 8.14 displays the dependency of the saturation magnetization as a function of the particle size according to Han et al. [7].
together with a fit based on Eq. (8.9).
Fitting the experimental data depicted in Figure 8.14 using Eq. (8.9) led for the
thickness of the “nonmagnetic” surface layer to a value of 0.8 nm for γFe 2 O 3 and
1 nm for CoFe 2 O 4 . Performing the same fitting procedure for the data depicted in
Figure 8.13 leads to a thickness of 0.7 nm for the surface layer. Taking all the
uncertainties connected to experimental data, especially with respect to particle
Figure 8.14 Saturation magnetization of γ-Fe 2 O 3 and CoFe 2 O 4 plotted versus particle
diameter. The fitted curve was calculated using Eq. (8.9). The experimental data were taken
from Han et al. [7].
0
20
40
60
80
particle diameter [nm]
0
20
40
60
80
saturation
magnetization
[A
m
2
kg
–1
]
Fe 2 O 3
CoFe 2 O 4