

8.2 Fundamentals of Superparamagnetism 159
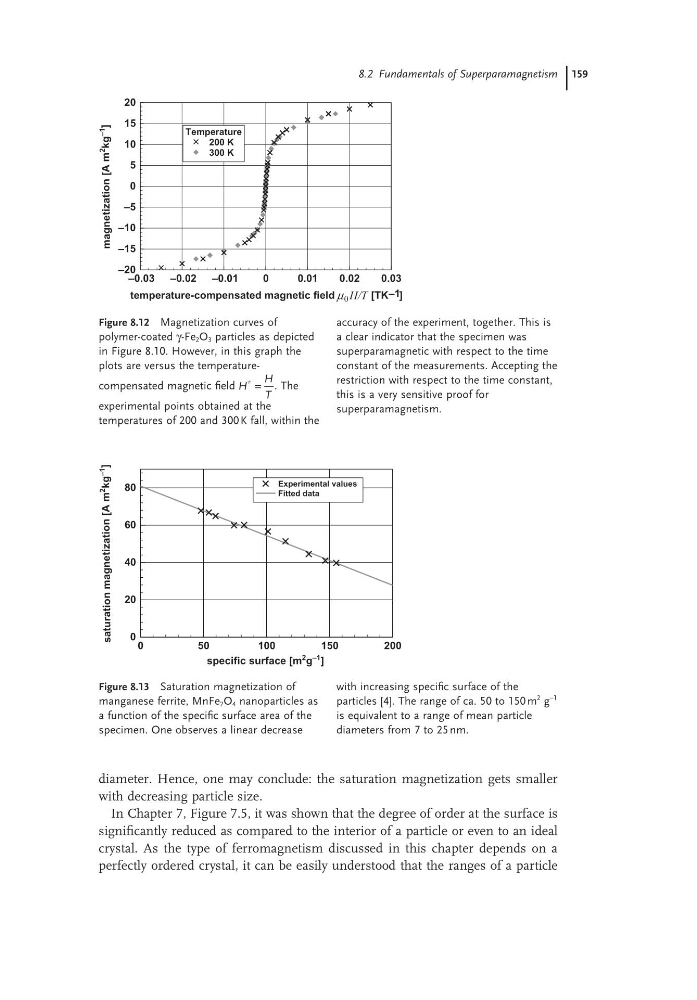
Figure 8.12 Magnetization curves of
polymer-coated γ-Fe 2 O 3 particles as depicted
in Figure 8.10. However, in this graph the
plots are versus the temperaturecompensated magnetic field H
H
T
* = . The
experimental points obtained at the
temperatures of 200 and 300 K fall, within the
accuracy of the experiment, together. This is
a clear indicator that the specimen was
superparamagnetic with respect to the time
constant of the measurements. Accepting the
restriction with respect to the time constant,
this is a very sensitive proof for
superparamagnetism.
–0.03 –0.02 –0.01
0
0.01
0.02
0.03
temperature-compensated magnetic field µ 0 H/T [TK –1 ]
–20
–15
–10
–5
0
5
10
15
20
magnetization
[A
m
2
kg
–1
]
Temperature
200 K
300 K
Figure 8.13 Saturation magnetization of
manganese ferrite, MnFe 2 O 4 nanoparticles as
a function of the specific surface area of the
specimen. One observes a linear decrease
with increasing specific surface of the
particles [4]. The range of ca. 50 to 150 m
2 g
−1
is equivalent to a range of mean particle
diameters from 7 to 25 nm.
0
50
100
150
200
specific surface [m
2 g
–1 ]
0
20
40
60
80
saturation
magnetization
[A
m
2
kg
–1
]
Experimental values
Fitted data
diameter. Hence, one may conclude: the saturation magnetization gets smaller
with decreasing particle size.
In Chapter 7, Figure 7.5, it was shown that the degree of order at the surface is
significantly reduced as compared to the interior of a particle or even to an ideal
crystal. As the type of ferromagnetism discussed in this chapter depends on a
perfectly ordered crystal, it can be easily understood that the ranges of a particle
Figure 8.12 Magnetization curves of
polymer-coated γ-Fe 2 O 3 particles as depicted
in Figure 8.10. However, in this graph the
plots are versus the temperaturecompensated magnetic field H
H
T
* = . The
experimental points obtained at the
temperatures of 200 and 300 K fall, within the
accuracy of the experiment, together. This is
a clear indicator that the specimen was
superparamagnetic with respect to the time
constant of the measurements. Accepting the
restriction with respect to the time constant,
this is a very sensitive proof for
superparamagnetism.
–0.03 –0.02 –0.01
0
0.01
0.02
0.03
temperature-compensated magnetic field µ 0 H/T [TK –1 ]
–20
–15
–10
–5
0
5
10
15
20
magnetization
[A
m
2
kg
–1
]
Temperature
200 K
300 K
Figure 8.13 Saturation magnetization of
manganese ferrite, MnFe 2 O 4 nanoparticles as
a function of the specific surface area of the
specimen. One observes a linear decrease
with increasing specific surface of the
particles [4]. The range of ca. 50 to 150 m
2 g
−1
is equivalent to a range of mean particle
diameters from 7 to 25 nm.
0
50
100
150
200
specific surface [m
2 g
–1 ]
0
20
40
60
80
saturation
magnetization
[A
m
2
kg
–1
]
Experimental values
Fitted data
diameter. Hence, one may conclude: the saturation magnetization gets smaller
with decreasing particle size.
In Chapter 7, Figure 7.5, it was shown that the degree of order at the surface is
significantly reduced as compared to the interior of a particle or even to an ideal
crystal. As the type of ferromagnetism discussed in this chapter depends on a
perfectly ordered crystal, it can be easily understood that the ranges of a particle