

7.3 Thermal Instabilities Connected to Phase Transformations 139
• The whole ensemble of the particles has a common thermal insulation against
the surrounding world, “global case”. Within the ensemble, the heat exchange
between the particles is instantaneous.
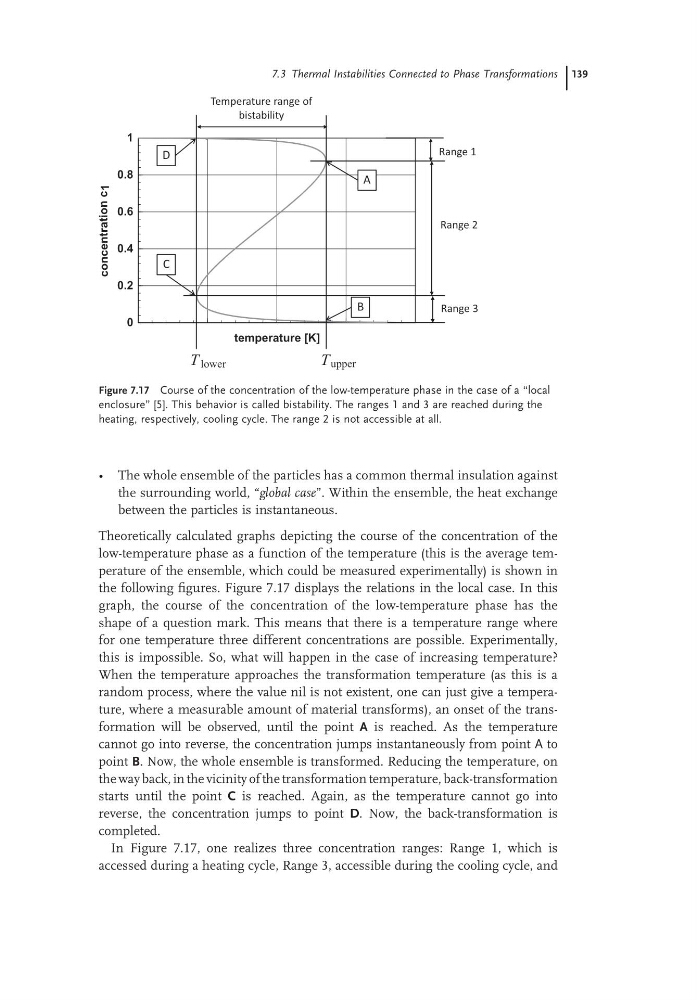
Theoretically calculated graphs depicting the course of the concentration of the
low-temperature phase as a function of the temperature (this is the average temperature of the ensemble, which could be measured experimentally) is shown in
the following figures. Figure 7.17 displays the relations in the local case. In this
graph, the course of the concentration of the low-temperature phase has the
shape of a question mark. This means that there is a temperature range where
for one temperature three different concentrations are possible. Experimentally,
this is impossible. So, what will happen in the case of increasing temperature?
When the temperature approaches the transformation temperature (as this is a
random process, where the value nil is not existent, one can just give a temperature, where a measurable amount of material transforms), an onset of the transformation will be observed, until the point A is reached. As the temperature
cannot go into reverse, the concentration jumps instantaneously from point A to
point B. Now, the whole ensemble is transformed. Reducing the temperature, on
the way back, in the vicinity of the transformation temperature, back-transformation
starts until the point C is reached. Again, as the temperature cannot go into
reverse, the concentration jumps to point D. Now, the back-transformation is
completed.
In Figure 7.17, one realizes three concentration ranges: Range 1, which is
accessed during a heating cycle, Range 3, accessible during the cooling cycle, and
Figure 7.17 Course of the concentration of the low-temperature phase in the case of a “local
enclosure” [5]. This behavior is called bistability. The ranges 1 and 3 are reached during the
heating, respectively, cooling cycle. The range 2 is not accessible at all.
395
400
405
410
415
temperature [K]
0
0.2
0.4
0.6
0.8
1
concentration
c 1
Temperature range of
bistability
Range 1
Range 2
Range 3
T lower
T upper
D
A
C
B
• The whole ensemble of the particles has a common thermal insulation against
the surrounding world, “global case”. Within the ensemble, the heat exchange
between the particles is instantaneous.
Theoretically calculated graphs depicting the course of the concentration of the
low-temperature phase as a function of the temperature (this is the average temperature of the ensemble, which could be measured experimentally) is shown in
the following figures. Figure 7.17 displays the relations in the local case. In this
graph, the course of the concentration of the low-temperature phase has the
shape of a question mark. This means that there is a temperature range where
for one temperature three different concentrations are possible. Experimentally,
this is impossible. So, what will happen in the case of increasing temperature?
When the temperature approaches the transformation temperature (as this is a
random process, where the value nil is not existent, one can just give a temperature, where a measurable amount of material transforms), an onset of the transformation will be observed, until the point A is reached. As the temperature
cannot go into reverse, the concentration jumps instantaneously from point A to
point B. Now, the whole ensemble is transformed. Reducing the temperature, on
the way back, in the vicinity of the transformation temperature, back-transformation
starts until the point C is reached. Again, as the temperature cannot go into
reverse, the concentration jumps to point D. Now, the back-transformation is
completed.
In Figure 7.17, one realizes three concentration ranges: Range 1, which is
accessed during a heating cycle, Range 3, accessible during the cooling cycle, and
Figure 7.17 Course of the concentration of the low-temperature phase in the case of a “local
enclosure” [5]. This behavior is called bistability. The ranges 1 and 3 are reached during the
heating, respectively, cooling cycle. The range 2 is not accessible at all.
395
400
405
410
415
temperature [K]
0
0.2
0.4
0.6
0.8
1
concentration
c 1
Temperature range of
bistability
Range 1
Range 2
Range 3
T lower
T upper
D
A
C
B