

138 7 Thermodynamics of Nanoparticles and Phase Transformations
Assuming an ensemble of particles, Figure 7.15 shows that there is a temperature range, where the probability to find particles of both phases is not nil. This
transition range widens with decreasing particle size; therefore, looking at bulk
materials, this phenomenon is not observed, one finds a well-defined temperature
of phase transition, for exmple, the melting point. This figure was calculated under
the assumption of an isothermal system. Certainly, this is an idealization, which
is not found in experimental reality, as least, because it takes time to transport
heat to or from the particles to the surrounding bath of constant temperature.
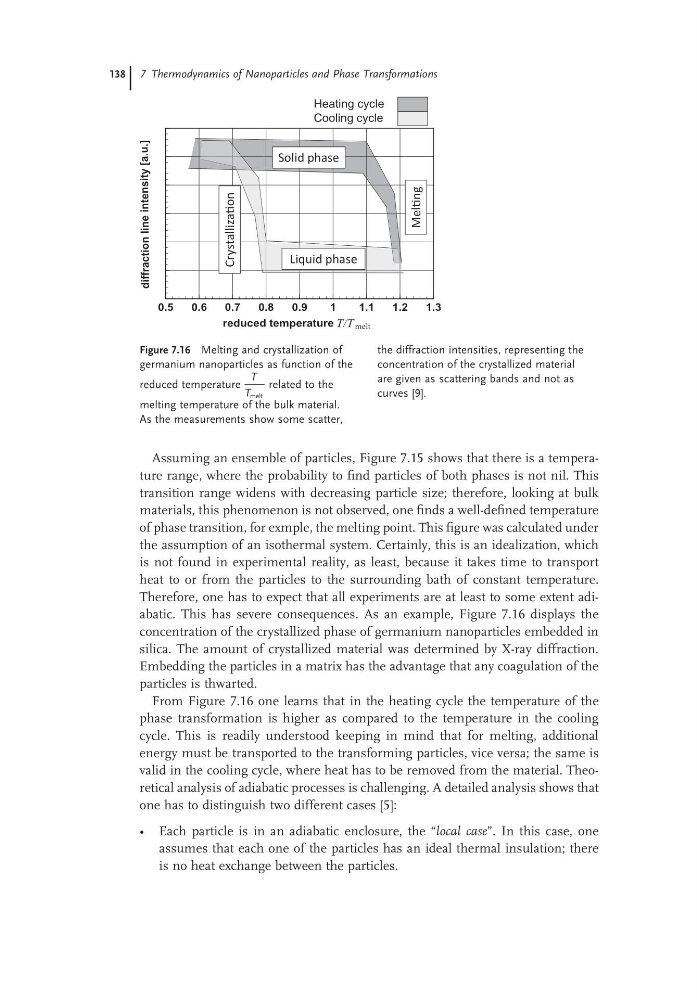
Therefore, one has to expect that all experiments are at least to some extent adiabatic. This has severe consequences. As an example, Figure 7.16 displays the
concentration of the crystallized phase of germanium nanoparticles embedded in
silica. The amount of crystallized material was determined by X-ray diffraction.
Embedding the particles in a matrix has the advantage that any coagulation of the
particles is thwarted.
From Figure 7.16 one learns that in the heating cycle the temperature of the
phase transformation is higher as compared to the temperature in the cooling
cycle. This is readily understood keeping in mind that for melting, additional
energy must be transported to the transforming particles, vice versa; the same is
valid in the cooling cycle, where heat has to be removed from the material. Theoretical analysis of adiabatic processes is challenging. A detailed analysis shows that
one has to distinguish two different cases [5]:
• Each particle is in an adiabatic enclosure, the “local case”. In this case, one
assumes that each one of the particles has an ideal thermal insulation; there
is no heat exchange between the particles.
Figure 7.16 Melting and crystallization of
germanium nanoparticles as function of the
reduced temperature
T
T melt
related to the
melting temperature of the bulk material.
As the measurements show some scatter,
the diffraction intensities, representing the
concentration of the crystallized material
are given as scattering bands and not as
curves [9].
0.5
0.6
0.7
0.8
0.9
1
1.1
1.2
1.3
reduced temperature T/T melt
0
100
200
300
400
500
600
] . u
.
a
[
y
t
i
s
n
e
t
n
i
e
n
i
l
n
o
i
t
c
a
r
f
f
i
d
Heating cycle
Cooling cycle
MelƟng
CrystallizaƟon
Solid phase
Liquid phase
Assuming an ensemble of particles, Figure 7.15 shows that there is a temperature range, where the probability to find particles of both phases is not nil. This
transition range widens with decreasing particle size; therefore, looking at bulk
materials, this phenomenon is not observed, one finds a well-defined temperature
of phase transition, for exmple, the melting point. This figure was calculated under
the assumption of an isothermal system. Certainly, this is an idealization, which
is not found in experimental reality, as least, because it takes time to transport
heat to or from the particles to the surrounding bath of constant temperature.
Therefore, one has to expect that all experiments are at least to some extent adiabatic. This has severe consequences. As an example, Figure 7.16 displays the
concentration of the crystallized phase of germanium nanoparticles embedded in
silica. The amount of crystallized material was determined by X-ray diffraction.
Embedding the particles in a matrix has the advantage that any coagulation of the
particles is thwarted.
From Figure 7.16 one learns that in the heating cycle the temperature of the
phase transformation is higher as compared to the temperature in the cooling
cycle. This is readily understood keeping in mind that for melting, additional
energy must be transported to the transforming particles, vice versa; the same is
valid in the cooling cycle, where heat has to be removed from the material. Theoretical analysis of adiabatic processes is challenging. A detailed analysis shows that
one has to distinguish two different cases [5]:
• Each particle is in an adiabatic enclosure, the “local case”. In this case, one
assumes that each one of the particles has an ideal thermal insulation; there
is no heat exchange between the particles.
Figure 7.16 Melting and crystallization of
germanium nanoparticles as function of the
reduced temperature
T
T melt
related to the
melting temperature of the bulk material.
As the measurements show some scatter,
the diffraction intensities, representing the
concentration of the crystallized material
are given as scattering bands and not as
curves [9].
0.5
0.6
0.7
0.8
0.9
1
1.1
1.2
1.3
reduced temperature T/T melt
0
100
200
300
400
500
600
] . u
.
a
[
y
t
i
s
n
e
t
n
i
e
n
i
l
n
o
i
t
c
a
r
f
f
i
d
Heating cycle
Cooling cycle
MelƟng
CrystallizaƟon
Solid phase
Liquid phase