

7.3 Thermal Instabilities Connected to Phase Transformations 135
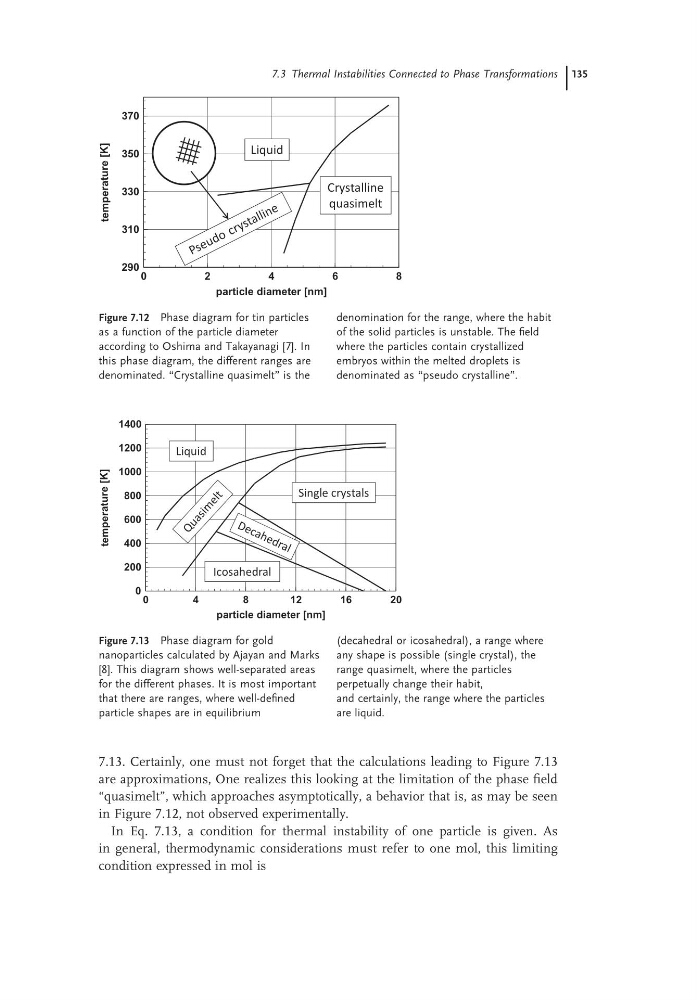
7.13. Certainly, one must not forget that the calculations leading to Figure 7.13
are approximations, One realizes this looking at the limitation of the phase field
“quasimelt”, which approaches asymptotically, a behavior that is, as may be seen
in Figure 7.12, not observed experimentally.
In Eq. 7.13, a condition for thermal instability of one particle is given. As
in general, thermodynamic considerations must refer to one mol, this limiting
condition expressed in mol is
Figure 7.12 Phase diagram for tin particles
as a function of the particle diameter
according to Oshima and Takayanagi [7]. In
this phase diagram, the different ranges are
denominated. “Crystalline quasimelt” is the
denomination for the range, where the habit
of the solid particles is unstable. The field
where the particles contain crystallized
embryos within the melted droplets is
denominated as “pseudo crystalline”.
0
2
4
6
8
particle diameter [nm]
290
310
330
350
370
temperature
[K]
Liquid
Crystalline
quasimelt
Figure 7.13 Phase diagram for gold
nanoparticles calculated by Ajayan and Marks
[8]. This diagram shows well-separated areas
for the different phases. It is most important
that there are ranges, where well-defined
particle shapes are in equilibrium
(decahedral or icosahedral), a range where
any shape is possible (single crystal), the
range quasimelt, where the particles
perpetually change their habit,
and certainly, the range where the particles
are liquid.
0
4
8
12
16
20
particle diameter [nm]
0
200
400
600
800
1000
1200
1400
temperature
[K]
Liquid
Single crystals
Icosahedral
7.13. Certainly, one must not forget that the calculations leading to Figure 7.13
are approximations, One realizes this looking at the limitation of the phase field
“quasimelt”, which approaches asymptotically, a behavior that is, as may be seen
in Figure 7.12, not observed experimentally.
In Eq. 7.13, a condition for thermal instability of one particle is given. As
in general, thermodynamic considerations must refer to one mol, this limiting
condition expressed in mol is
Figure 7.12 Phase diagram for tin particles
as a function of the particle diameter
according to Oshima and Takayanagi [7]. In
this phase diagram, the different ranges are
denominated. “Crystalline quasimelt” is the
denomination for the range, where the habit
of the solid particles is unstable. The field
where the particles contain crystallized
embryos within the melted droplets is
denominated as “pseudo crystalline”.
0
2
4
6
8
particle diameter [nm]
290
310
330
350
370
temperature
[K]
Liquid
Crystalline
quasimelt
Figure 7.13 Phase diagram for gold
nanoparticles calculated by Ajayan and Marks
[8]. This diagram shows well-separated areas
for the different phases. It is most important
that there are ranges, where well-defined
particle shapes are in equilibrium
(decahedral or icosahedral), a range where
any shape is possible (single crystal), the
range quasimelt, where the particles
perpetually change their habit,
and certainly, the range where the particles
are liquid.
0
4
8
12
16
20
particle diameter [nm]
0
200
400
600
800
1000
1200
1400
temperature
[K]
Liquid
Single crystals
Icosahedral