

136 7 Thermodynamics of Nanoparticles and Phase Transformations
∆
∆
g
M
N
G
M
N
G G
kT
=
=
−
(
) ≤
1
2
.
(7.14)
The quantity M stands for the molecular weight and n for the number of
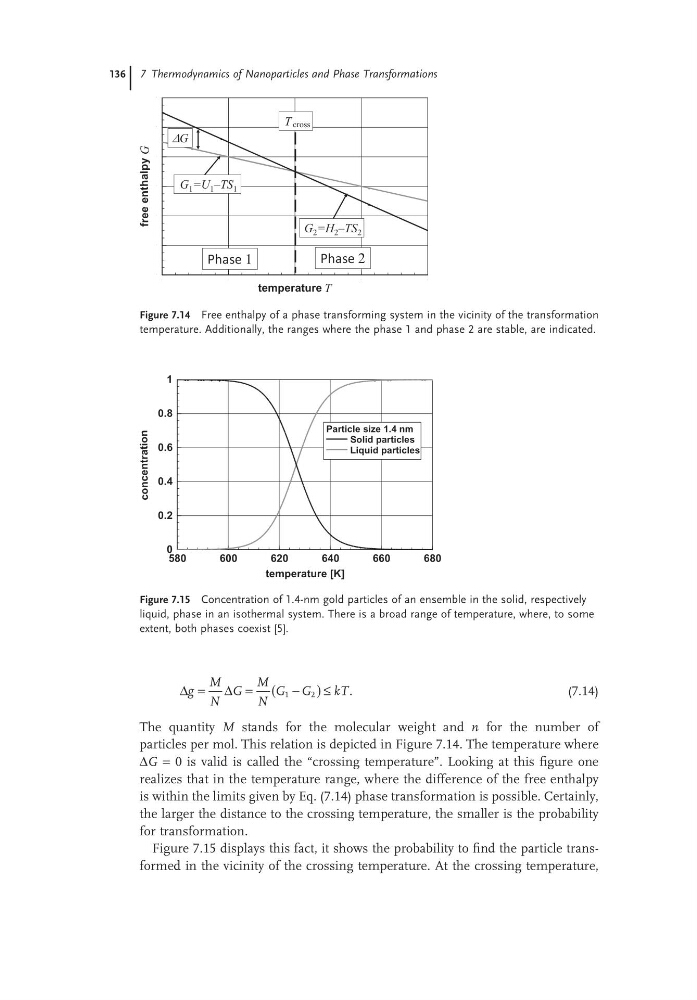
particles per mol. This relation is depicted in Figure 7.14. The temperature where
ΔG = 0 is valid is called the “crossing temperature”. Looking at this figure one
realizes that in the temperature range, where the difference of the free enthalpy
is within the limits given by Eq. (7.14) phase transformation is possible. Certainly,
the larger the distance to the crossing temperature, the smaller is the probability
for transformation.
Figure 7.15 displays this fact, it shows the probability to find the particle transformed in the vicinity of the crossing temperature. At the crossing temperature,
Figure 7.14 Free enthalpy of a phase transforming system in the vicinity of the transformation
temperature. Additionally, the ranges where the phase 1 and phase 2 are stable, are indicated.
∆G
G 1 =U 1 –TS 1
G 2 =H 2 –TS 2
T cross
Phase 1
Phase 2
4
6
8
10
12
temperature T
0
2
4
6
8
10
12
free
enthalpy G
Figure 7.15 Concentration of 1.4-nm gold particles of an ensemble in the solid, respectively
liquid, phase in an isothermal system. There is a broad range of temperature, where, to some
extent, both phases coexist [5].
580
600
620
640
660
680
temperature [K]
0
0.2
0.4
0.6
0.8
1
concentration
Particle size 1.4 nm
Solid particles
Liquid particles
∆
∆
g
M
N
G
M
N
G G
kT
=
=
−
(
) ≤
1
2
.
(7.14)
The quantity M stands for the molecular weight and n for the number of
particles per mol. This relation is depicted in Figure 7.14. The temperature where
ΔG = 0 is valid is called the “crossing temperature”. Looking at this figure one
realizes that in the temperature range, where the difference of the free enthalpy
is within the limits given by Eq. (7.14) phase transformation is possible. Certainly,
the larger the distance to the crossing temperature, the smaller is the probability
for transformation.
Figure 7.15 displays this fact, it shows the probability to find the particle transformed in the vicinity of the crossing temperature. At the crossing temperature,
Figure 7.14 Free enthalpy of a phase transforming system in the vicinity of the transformation
temperature. Additionally, the ranges where the phase 1 and phase 2 are stable, are indicated.
∆G
G 1 =U 1 –TS 1
G 2 =H 2 –TS 2
T cross
Phase 1
Phase 2
4
6
8
10
12
temperature T
0
2
4
6
8
10
12
free
enthalpy G
Figure 7.15 Concentration of 1.4-nm gold particles of an ensemble in the solid, respectively
liquid, phase in an isothermal system. There is a broad range of temperature, where, to some
extent, both phases coexist [5].
580
600
620
640
660
680
temperature [K]
0
0.2
0.4
0.6
0.8
1
concentration
Particle size 1.4 nm
Solid particles
Liquid particles