

7.2 Influence of the Particle Size on Thermodynamic Properties and Phase Transformations 127
pronounced when the particle gets smaller. A particle with a radius of 5 nm shows
a similar lack of ordering at the surface; however, in addition, one sees imperfect
ordering in the center of the particle, too. This tendency is increased for a particle
with a diameter of 4 nm. In this case, in the center, the order parameter is just a
little more than 0.5; whereas this parameter is less than 0.25 at the surface. These
calculations confirm the considerations and the experimental results of Coombes
[2]. The relation of decreasing order with decreasing particle size and from the
interior to the outside is even clearer in Figure 7.5b. In this figure the order
parameter in the center and at the surface is plotted versus the particle size.
Looking at the smallest particles, one has the impression that they are closer to a
liquid than to a solid.
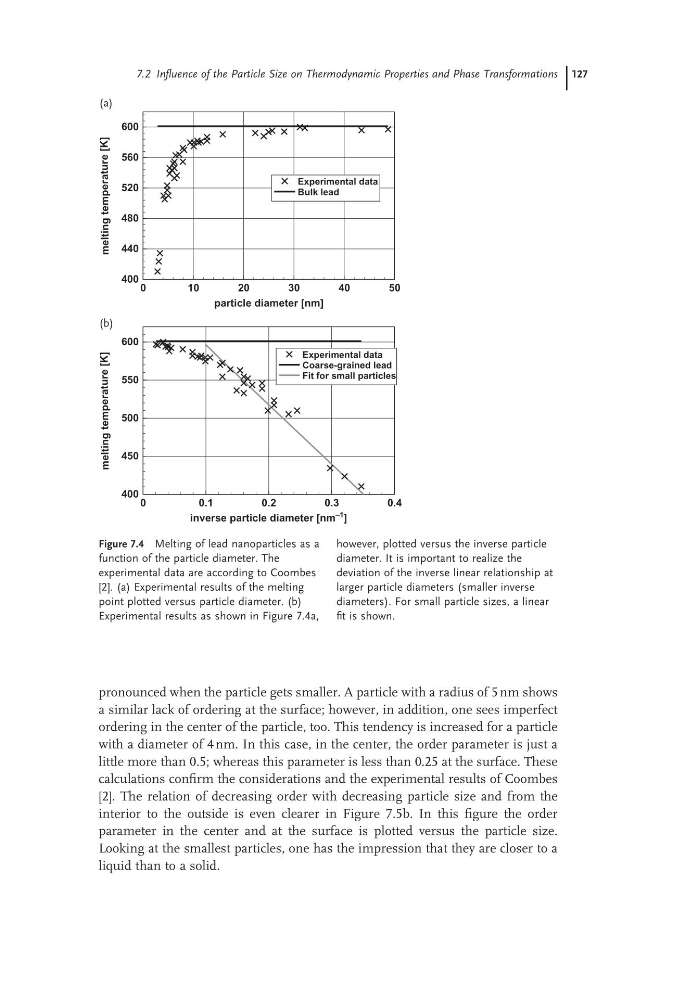
Figure 7.4 Melting of lead nanoparticles as a
function of the particle diameter. The
experimental data are according to Coombes
[2]. (a) Experimental results of the melting
point plotted versus particle diameter. (b)
Experimental results as shown in Figure 7.4a,
however, plotted versus the inverse particle
diameter. It is important to realize the
deviation of the inverse linear relationship at
larger particle diameters (smaller inverse
diameters). For small particle sizes, a linear
fit is shown.
0
10
20
30
40
50
particle diameter [nm]
400
440
480
520
560
600
melting
temperature
[K]
Experimental data
Bulk lead
0
0.1
0.2
0.3
0.4
inverse particle diameter [nm
–1 ]
400
450
500
550
600
melting
temperature
[K]
Experimental data
Coarse-grained lead
Fit for small particles
(a)
(b)
pronounced when the particle gets smaller. A particle with a radius of 5 nm shows
a similar lack of ordering at the surface; however, in addition, one sees imperfect
ordering in the center of the particle, too. This tendency is increased for a particle
with a diameter of 4 nm. In this case, in the center, the order parameter is just a
little more than 0.5; whereas this parameter is less than 0.25 at the surface. These
calculations confirm the considerations and the experimental results of Coombes
[2]. The relation of decreasing order with decreasing particle size and from the
interior to the outside is even clearer in Figure 7.5b. In this figure the order
parameter in the center and at the surface is plotted versus the particle size.
Looking at the smallest particles, one has the impression that they are closer to a
liquid than to a solid.
Figure 7.4 Melting of lead nanoparticles as a
function of the particle diameter. The
experimental data are according to Coombes
[2]. (a) Experimental results of the melting
point plotted versus particle diameter. (b)
Experimental results as shown in Figure 7.4a,
however, plotted versus the inverse particle
diameter. It is important to realize the
deviation of the inverse linear relationship at
larger particle diameters (smaller inverse
diameters). For small particle sizes, a linear
fit is shown.
0
10
20
30
40
50
particle diameter [nm]
400
440
480
520
560
600
melting
temperature
[K]
Experimental data
Bulk lead
0
0.1
0.2
0.3
0.4
inverse particle diameter [nm
–1 ]
400
450
500
550
600
melting
temperature
[K]
Experimental data
Coarse-grained lead
Fit for small particles
(a)
(b)