

5.3 Nanostructures Related to Compounds with Layered Structures 107
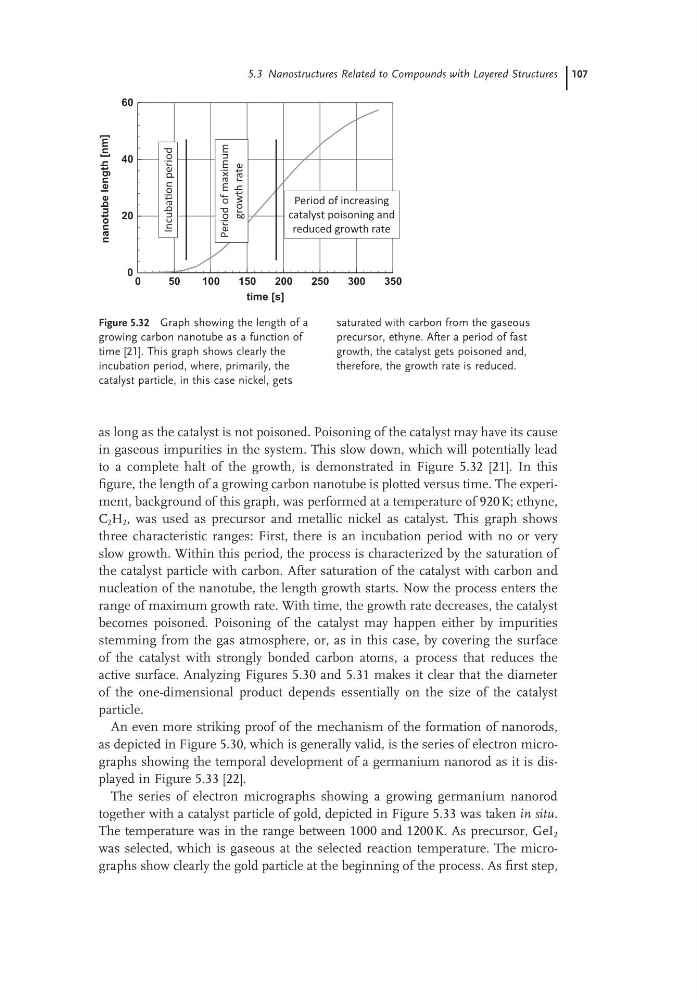
Figure 5.32 Graph showing the length of a
growing carbon nanotube as a function of
time [21]. This graph shows clearly the
incubation period, where, primarily, the
catalyst particle, in this case nickel, gets
saturated with carbon from the gaseous
precursor, ethyne. After a period of fast
growth, the catalyst gets poisoned and,
therefore, the growth rate is reduced.
0
50
100
150
200
250
300
350
time [s]
0
20
40
60
nanotube
length
[nm]
IncubaƟon period
Period of maximum
growth rate
Period of increasing
catalyst poisoning and
reduced growth rate
as long as the catalyst is not poisoned. Poisoning of the catalyst may have its cause
in gaseous impurities in the system. This slow down, which will potentially lead
to a complete halt of the growth, is demonstrated in Figure 5.32 [21]. In this
figure, the length of a growing carbon nanotube is plotted versus time. The experiment, background of this graph, was performed at a temperature of 920 K; ethyne,
C 2 H 2 , was used as precursor and metallic nickel as catalyst. This graph shows
three characteristic ranges: First, there is an incubation period with no or very
slow growth. Within this period, the process is characterized by the saturation of
the catalyst particle with carbon. After saturation of the catalyst with carbon and
nucleation of the nanotube, the length growth starts. Now the process enters the
range of maximum growth rate. With time, the growth rate decreases, the catalyst
becomes poisoned. Poisoning of the catalyst may happen either by impurities
stemming from the gas atmosphere, or, as in this case, by covering the surface
of the catalyst with strongly bonded carbon atoms, a process that reduces the
active surface. Analyzing Figures 5.30 and 5.31 makes it clear that the diameter
of the one-dimensional product depends essentially on the size of the catalyst
particle.
An even more striking proof of the mechanism of the formation of nanorods,
as depicted in Figure 5.30, which is generally valid, is the series of electron micrographs showing the temporal development of a germanium nanorod as it is displayed in Figure 5.33 [22].
The series of electron micrographs showing a growing germanium nanorod
together with a catalyst particle of gold, depicted in Figure 5.33 was taken in situ.
The temperature was in the range between 1000 and 1200 K. As precursor, GeI 2
was selected, which is gaseous at the selected reaction temperature. The micrographs show clearly the gold particle at the beginning of the process. As first step,
Figure 5.32 Graph showing the length of a
growing carbon nanotube as a function of
time [21]. This graph shows clearly the
incubation period, where, primarily, the
catalyst particle, in this case nickel, gets
saturated with carbon from the gaseous
precursor, ethyne. After a period of fast
growth, the catalyst gets poisoned and,
therefore, the growth rate is reduced.
0
50
100
150
200
250
300
350
time [s]
0
20
40
60
nanotube
length
[nm]
IncubaƟon period
Period of maximum
growth rate
Period of increasing
catalyst poisoning and
reduced growth rate
as long as the catalyst is not poisoned. Poisoning of the catalyst may have its cause
in gaseous impurities in the system. This slow down, which will potentially lead
to a complete halt of the growth, is demonstrated in Figure 5.32 [21]. In this
figure, the length of a growing carbon nanotube is plotted versus time. The experiment, background of this graph, was performed at a temperature of 920 K; ethyne,
C 2 H 2 , was used as precursor and metallic nickel as catalyst. This graph shows
three characteristic ranges: First, there is an incubation period with no or very
slow growth. Within this period, the process is characterized by the saturation of
the catalyst particle with carbon. After saturation of the catalyst with carbon and
nucleation of the nanotube, the length growth starts. Now the process enters the
range of maximum growth rate. With time, the growth rate decreases, the catalyst
becomes poisoned. Poisoning of the catalyst may happen either by impurities
stemming from the gas atmosphere, or, as in this case, by covering the surface
of the catalyst with strongly bonded carbon atoms, a process that reduces the
active surface. Analyzing Figures 5.30 and 5.31 makes it clear that the diameter
of the one-dimensional product depends essentially on the size of the catalyst
particle.
An even more striking proof of the mechanism of the formation of nanorods,
as depicted in Figure 5.30, which is generally valid, is the series of electron micrographs showing the temporal development of a germanium nanorod as it is displayed in Figure 5.33 [22].
The series of electron micrographs showing a growing germanium nanorod
together with a catalyst particle of gold, depicted in Figure 5.33 was taken in situ.
The temperature was in the range between 1000 and 1200 K. As precursor, GeI 2
was selected, which is gaseous at the selected reaction temperature. The micrographs show clearly the gold particle at the beginning of the process. As first step,