

96 5 One- and Two-Dimensional Nanoparticles
Carbon nanotubes and graphene are widely discussed, because there are many
potential high value added applications. These applications are either connected
to the high strength of these materials or to their electrical and optical properties. In the following, a typical application exploiting the electrical properties is
described. For electronic displays, needed everywhere in the modern world, from
computer displays to TV sets or smart phones, one needs optically transparent
electrical conductors. Nowadays, one applies ITO, a solid solution of two oxides,
consisting of roughly 90 wt% In 2 O 3 and 10 wt% SnO 2 . ITO has a few severe disadvantages, it is brittle, so it is not well suited for flexible substrates and, it is not
printable, ITO conductors are prepared by high-vacuum sputtering. In contrast,
electrically conductive nanocomposites consisting of a polymer and carbon nanotubes or graphene should not exhibit these disadvantages. Therefore, one has to
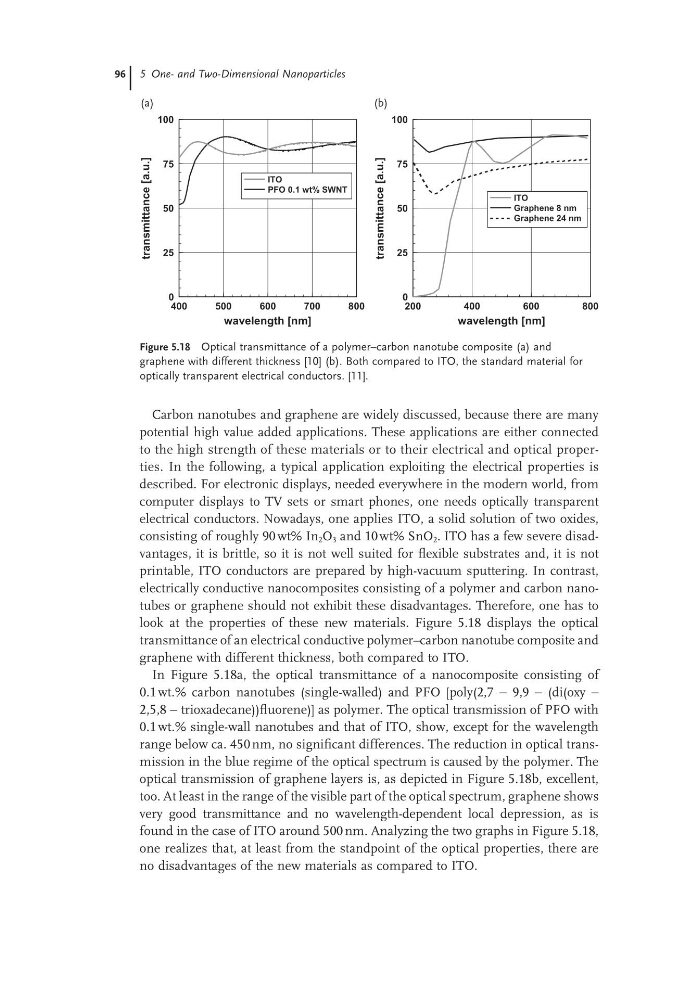
look at the properties of these new materials. Figure 5.18 displays the optical
transmittance of an electrical conductive polymer–carbon nanotube composite and
graphene with different thickness, both compared to ITO.
In Figure 5.18a, the optical transmittance of a nanocomposite consisting of
0.1 wt.% carbon nanotubes (single-walled) and PFO [poly(2,7 − 9,9 − (di(oxy −
2,5,8 − trioxadecane))fluorene)] as polymer. The optical transmission of PFO with
0.1 wt.% single-wall nanotubes and that of ITO, show, except for the wavelength
range below ca. 450 nm, no significant differences. The reduction in optical transmission in the blue regime of the optical spectrum is caused by the polymer. The
optical transmission of graphene layers is, as depicted in Figure 5.18b, excellent,
too. At least in the range of the visible part of the optical spectrum, graphene shows
very good transmittance and no wavelength-dependent local depression, as is
found in the case of ITO around 500 nm. Analyzing the two graphs in Figure 5.18,
one realizes that, at least from the standpoint of the optical properties, there are
no disadvantages of the new materials as compared to ITO.
Figure 5.18 Optical transmittance of a polymer–carbon nanotube composite (a) and
graphene with different thickness [10] (b). Both compared to ITO, the standard material for
optically transparent electrical conductors. [11].
400
500
600
700
800
wavelength [nm]
0
25
50
75
100
transmittance
[a.u.]
ITO
PFO 0.1 wt% SWNT
200
400
600
800
wavelength [nm]
0
25
50
75
100
transmittance
[a.u.]
ITO
Graphene 8 nm
Graphene 24 nm
(a)
(b)
Carbon nanotubes and graphene are widely discussed, because there are many
potential high value added applications. These applications are either connected
to the high strength of these materials or to their electrical and optical properties. In the following, a typical application exploiting the electrical properties is
described. For electronic displays, needed everywhere in the modern world, from
computer displays to TV sets or smart phones, one needs optically transparent
electrical conductors. Nowadays, one applies ITO, a solid solution of two oxides,
consisting of roughly 90 wt% In 2 O 3 and 10 wt% SnO 2 . ITO has a few severe disadvantages, it is brittle, so it is not well suited for flexible substrates and, it is not
printable, ITO conductors are prepared by high-vacuum sputtering. In contrast,
electrically conductive nanocomposites consisting of a polymer and carbon nanotubes or graphene should not exhibit these disadvantages. Therefore, one has to
look at the properties of these new materials. Figure 5.18 displays the optical
transmittance of an electrical conductive polymer–carbon nanotube composite and
graphene with different thickness, both compared to ITO.
In Figure 5.18a, the optical transmittance of a nanocomposite consisting of
0.1 wt.% carbon nanotubes (single-walled) and PFO [poly(2,7 − 9,9 − (di(oxy −
2,5,8 − trioxadecane))fluorene)] as polymer. The optical transmission of PFO with
0.1 wt.% single-wall nanotubes and that of ITO, show, except for the wavelength
range below ca. 450 nm, no significant differences. The reduction in optical transmission in the blue regime of the optical spectrum is caused by the polymer. The
optical transmission of graphene layers is, as depicted in Figure 5.18b, excellent,
too. At least in the range of the visible part of the optical spectrum, graphene shows
very good transmittance and no wavelength-dependent local depression, as is
found in the case of ITO around 500 nm. Analyzing the two graphs in Figure 5.18,
one realizes that, at least from the standpoint of the optical properties, there are
no disadvantages of the new materials as compared to ITO.
Figure 5.18 Optical transmittance of a polymer–carbon nanotube composite (a) and
graphene with different thickness [10] (b). Both compared to ITO, the standard material for
optically transparent electrical conductors. [11].
400
500
600
700
800
wavelength [nm]
0
25
50
75
100
transmittance
[a.u.]
ITO
PFO 0.1 wt% SWNT
200
400
600
800
wavelength [nm]
0
25
50
75
100
transmittance
[a.u.]
ITO
Graphene 8 nm
Graphene 24 nm
(a)
(b)